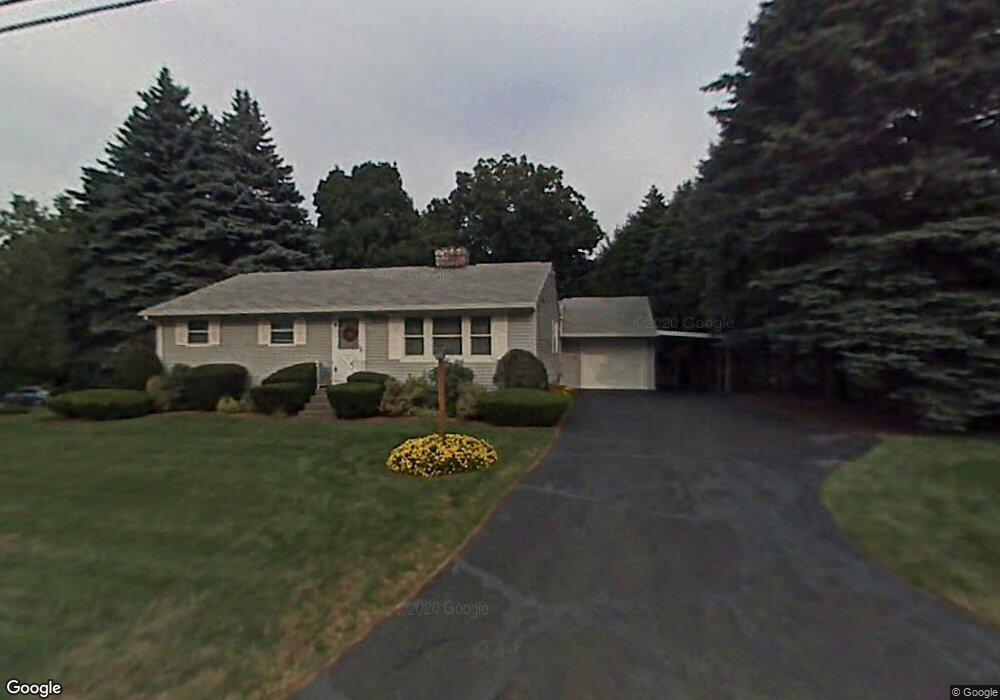
54 Cook St Holden, MA 01520
Estimated Value: $447,000 - $581,000
About This Home
This home is located at 54 Cook St, Holden, MA 01520 and is currently estimated at $523,849, approximately $268 per square foot. 54 Cook St is a home located in Worcester County with nearby schools including Wachusett Regional High School, Abby Kelley Foster Charter Public School, and Bancroft School.
Ownership History
We collect this data history from publicly available records. To have your information removed, we recommend requesting removal directly through your county’s website.
Purchase Details
Home Financials for this Owner
Home Financials are based on the most recent Mortgage that was taken out on this home.Purchase Details
Home Values in the Area
Average Home Value in this Area
Purchase History
We collect this data history from publicly available records. To have your information removed, we recommend requesting removal directly through your county’s website.
| Date | Buyer | Sale Price | Title Company |
|---|---|---|---|
| $450,000 | None Available | ||
| $450,000 | None Available | ||
| -- | -- | ||
| -- | -- |
Mortgage History
We collect this data history from publicly available records. To have your information removed, we recommend requesting removal directly through your county’s website.
| Date | Status | Borrower | Loan Amount |
|---|---|---|---|
| Open | $461,487 | ||
| Closed | $461,487 |
Tax History
We collect this data history from publicly available records. To have your information removed, we recommend requesting removal directly through your county’s website.
| Year | Tax Paid | Tax Assessment Tax Assessment Total Assessment is a certain percentage of the fair market value that is determined by local assessors to be the total taxable value of land and additions on the property. | Land | Improvement |
|---|---|---|---|---|
| 2025 | $6,951 | $501,500 | $146,000 | $355,500 |
| 2024 | $7,067 | $499,400 | $141,700 | $357,700 |
| 2023 | $6,882 | $459,100 | $123,200 | $335,900 |
| 2022 | $6,796 | $410,400 | $96,300 | $314,100 |
| 2021 | $6,528 | $375,200 | $91,600 | $283,600 |
| 2020 | $6,010 | $353,500 | $87,300 | $266,200 |
| 2019 | $2 | $336,100 | $87,300 | $248,800 |
| 2018 | $5,526 | $313,800 | $83,200 | $230,600 |
| 2017 | $2 | $304,900 | $83,200 | $221,700 |
| 2016 | $4,035 | $233,900 | $79,200 | $154,700 |
| 2015 | $4,006 | $221,100 | $79,200 | $141,900 |
| 2014 | $3,925 | $221,100 | $79,200 | $141,900 |
Map
- 46 Pinecroft Ave
- 19 Birch Ave
- 622 Shrewsbury St
- 239 Woodland St Unit 3
- 515 Prospect St
- 30 Mountainshire Dr
- 21 Arrowsic St
- 87 Malden St
- 6 Idalla Ave
- 25 Pheasant Hill Run
- 59 Castine St
- 149 Woodland St
- 42 Castine St Unit 1
- 42 Castine St
- 328 Brooks St
- 24 Park Villa Ave
- 42 Wilbur St
- 15 Tyler Dr
- 28 Ladybank Rd
- 189 Holden St
Ask me questions while you tour the home.