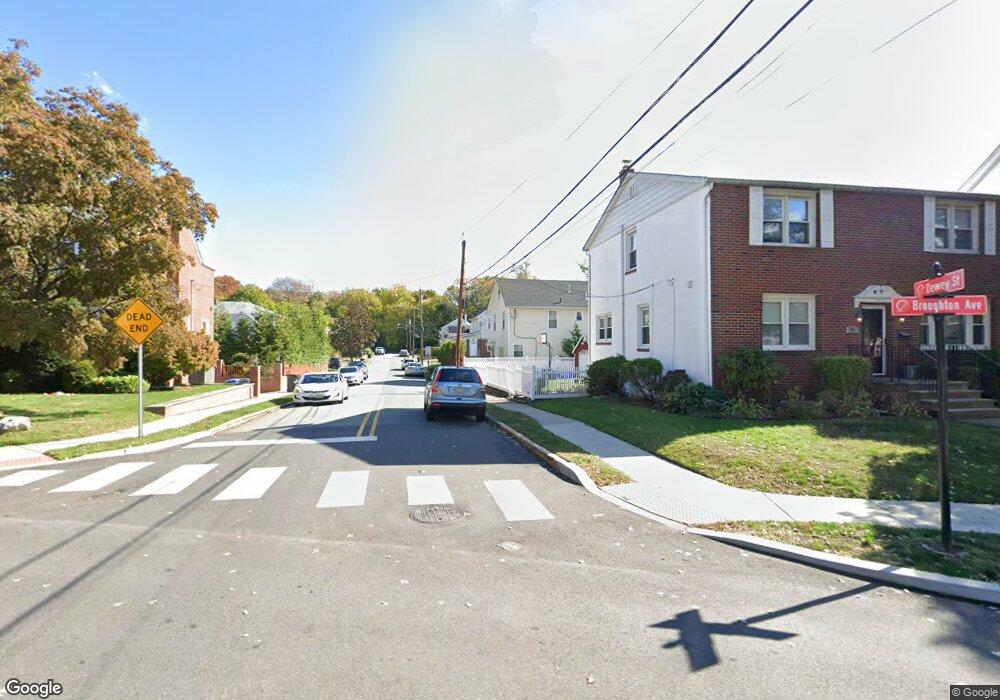
54 Dewey St Unit 56 Bloomfield, NJ 07003
Estimated Value: $674,000 - $935,000
Studio
--
Bath
2,433
Sq Ft
$308/Sq Ft
Est. Value
About This Home
This home is located at 54 Dewey St Unit 56, Bloomfield, NJ 07003 and is currently estimated at $749,160, approximately $307 per square foot. 54 Dewey St Unit 56 is a home located in Essex County with nearby schools including Demarest School, Bloomfield Middle School, and Bloomfield High School.
Ownership History
Date
Name
Owned For
Owner Type
Purchase Details
Closed on
Oct 28, 2009
Sold by
Property Asset Management Inc
Bought by
Osco Cesar R and Polanco Giancarlo
Current Estimated Value
Home Financials for this Owner
Home Financials are based on the most recent Mortgage that was taken out on this home.
Original Mortgage
$208,000
Outstanding Balance
$133,459
Interest Rate
4.98%
Mortgage Type
New Conventional
Estimated Equity
$615,701
Purchase Details
Closed on
May 18, 2009
Sold by
Tracey Douglas A and Mrs Douglas A Tracey
Bought by
Property Asset Management Inc
Purchase Details
Closed on
Oct 15, 1999
Sold by
Booker Altomese
Bought by
Toure Lamine M
Create a Home Valuation Report for This Property
The Home Valuation Report is an in-depth analysis detailing your home's value as well as a comparison with similar homes in the area
Home Values in the Area
Average Home Value in this Area
Purchase History
| Date | Buyer | Sale Price | Title Company |
|---|---|---|---|
| Osco Cesar R | $260,000 | A Mason Title Agency | |
| Property Asset Management Inc | -- | First American Title Ins Co | |
| Toure Lamine M | $155,000 | -- | |
| Toure Lamine M | $155,000 | -- |
Source: Public Records
Mortgage History
| Date | Status | Borrower | Loan Amount |
|---|---|---|---|
| Open | Osco Cesar R | $208,000 |
Source: Public Records
Tax History
| Year | Tax Paid | Tax Assessment Tax Assessment Total Assessment is a certain percentage of the fair market value that is determined by local assessors to be the total taxable value of land and additions on the property. | Land | Improvement |
|---|---|---|---|---|
| 2025 | $15,040 | $443,400 | $142,700 | $300,700 |
| 2024 | $14,490 | $443,400 | $142,700 | $300,700 |
| 2022 | $14,198 | $443,400 | $142,700 | $300,700 |
| 2021 | $13,936 | $443,400 | $142,700 | $300,700 |
| 2020 | $13,723 | $443,400 | $142,700 | $300,700 |
| 2019 | $11,051 | $277,600 | $116,000 | $161,600 |
| 2018 | $11,004 | $277,600 | $116,000 | $161,600 |
| 2017 | $10,838 | $277,600 | $116,000 | $161,600 |
| 2016 | $10,715 | $277,600 | $116,000 | $161,600 |
| 2015 | $10,618 | $277,600 | $116,000 | $161,600 |
| 2014 | $10,424 | $277,600 | $116,000 | $161,600 |
Source: Public Records
Map
Nearby Homes
- 383-387 Broughton Ave
- 387 Broughton Ave
- 322 Broughton Ave
- 81 Hastings Ave
- 78 Hastings Ave
- 35 Hastings Ave
- 7 Faber Place
- 209 Van Winkle Ave
- 33 Daka Ct
- 476 Harrison St
- 935 Broad St Unit 35B
- 9 Pierson St
- 138 Spatz Ave
- 95 Mohr Ave
- 51 Albert Terrace
- 93 Bromley Place
- 20 Elston St
- 22 Vine St
- 106 Broughton Ave
- 52 Greenbrook Dr
Your Personal Tour Guide
Ask me questions while you tour the home.