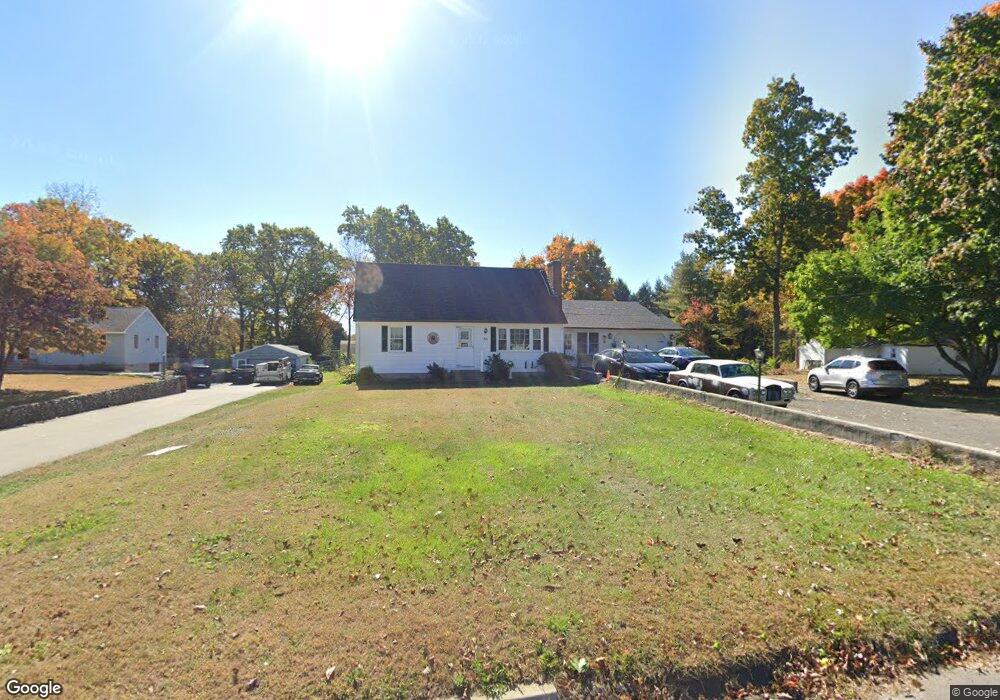
54 Mine Rd Bristol, CT 06010
North Bristol NeighborhoodEstimated Value: $352,000 - $395,290
4
Beds
3
Baths
1,426
Sq Ft
$264/Sq Ft
Est. Value
About This Home
This home is located at 54 Mine Rd, Bristol, CT 06010 and is currently estimated at $375,823, approximately $263 per square foot. 54 Mine Rd is a home located in Hartford County with nearby schools including Ivy Drive School, Northeast Middle School, and Bristol Eastern High School.
Ownership History
Date
Name
Owned For
Owner Type
Purchase Details
Closed on
Jun 19, 2019
Sold by
Dennis Alan G and Dennis Sandra A
Bought by
Martinez Carlos and Gillette Tina
Current Estimated Value
Home Financials for this Owner
Home Financials are based on the most recent Mortgage that was taken out on this home.
Original Mortgage
$161,500
Outstanding Balance
$140,509
Interest Rate
4%
Mortgage Type
New Conventional
Estimated Equity
$235,314
Purchase Details
Closed on
Jul 15, 1977
Bought by
Dennis Alan G and Dennis Sandra A
Create a Home Valuation Report for This Property
The Home Valuation Report is an in-depth analysis detailing your home's value as well as a comparison with similar homes in the area
Home Values in the Area
Average Home Value in this Area
Purchase History
We collect this data history from publicly available records. To have your information removed, we recommend requesting removal directly through your county’s website.
| Date | Buyer | Sale Price | Title Company |
|---|---|---|---|
| Martinez Carlos | $170,000 | -- | |
| Dennis Alan G | -- | -- |
Source: Public Records
Mortgage History
We collect this data history from publicly available records. To have your information removed, we recommend requesting removal directly through your county’s website.
| Date | Status | Borrower | Loan Amount |
|---|---|---|---|
| Open | Martinez Carlos | $161,500 | |
| Previous Owner | Dennis Alan G | $74,000 | |
| Previous Owner | Dennis Alan G | $103,000 |
Source: Public Records
Tax History
| Year | Tax Paid | Tax Assessment Tax Assessment Total Assessment is a certain percentage of the fair market value that is determined by local assessors to be the total taxable value of land and additions on the property. | Land | Improvement |
|---|---|---|---|---|
| 2025 | $7,291 | $216,020 | $61,600 | $154,420 |
| 2024 | $6,793 | $213,290 | $61,600 | $151,690 |
| 2023 | $6,473 | $213,290 | $61,600 | $151,690 |
| 2022 | $5,611 | $146,300 | $42,770 | $103,530 |
| 2021 | $5,611 | $146,300 | $42,770 | $103,530 |
| 2020 | $5,611 | $146,300 | $42,770 | $103,530 |
| 2019 | $5,567 | $146,300 | $42,770 | $103,530 |
| 2018 | $5,396 | $146,300 | $42,770 | $103,530 |
| 2017 | $5,410 | $150,150 | $61,110 | $89,040 |
| 2016 | $5,410 | $150,150 | $61,110 | $89,040 |
| 2015 | $5,197 | $150,150 | $61,110 | $89,040 |
| 2014 | $5,197 | $150,150 | $61,110 | $89,040 |
Source: Public Records
Map
Nearby Homes
- 1044 Jerome Ave
- 177 Mines Rd
- 46 Buckboard Ln
- 79 Buckboard Ln
- 6 Pine Hill Rd
- 90 Orleans Dr
- 14 Bridgeport Ave
- 177 Fox Den Rd
- 14 Deer Park Rd
- 275 Country Ln
- 14 Burlwood Dr
- 139 Strawberry Hill Rd
- 79 Strawberry Hill Rd
- 69 Strawberry Hill Rd
- 119 Cherry Hill Dr
- 109 Rambler St
- 220 Monce Rd Unit 17
- 32 Loveland Ln
- 85 Wildewood Run
- 196 Shagbark Dr
Your Personal Tour Guide
Ask me questions while you tour the home.