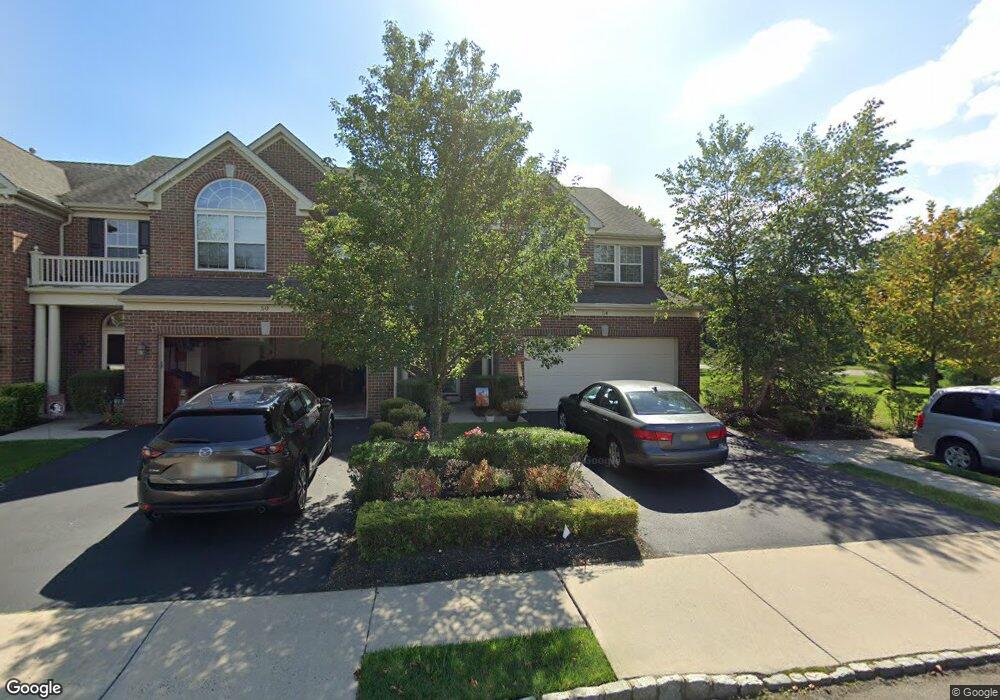
54 Oak Leaf Ln Tinton Falls, NJ 07712
Estimated Value: $643,000 - $687,000
3
Beds
2
Baths
2,196
Sq Ft
$306/Sq Ft
Est. Value
About This Home
This home is located at 54 Oak Leaf Ln, Tinton Falls, NJ 07712 and is currently estimated at $671,335, approximately $305 per square foot. 54 Oak Leaf Ln is a home located in Monmouth County with nearby schools including Mahala F. Atchinson Elementary School, Swimming River Elementary School, and Tinton Falls Middle School.
Ownership History
Date
Name
Owned For
Owner Type
Purchase Details
Closed on
Dec 19, 2008
Sold by
Nvr Inc
Bought by
Ruvelas Billy G and Ruvelas Ann Marie
Current Estimated Value
Home Financials for this Owner
Home Financials are based on the most recent Mortgage that was taken out on this home.
Original Mortgage
$287,200
Outstanding Balance
$189,303
Interest Rate
6.08%
Mortgage Type
Purchase Money Mortgage
Estimated Equity
$482,032
Purchase Details
Closed on
Jul 15, 2008
Sold by
Cjs Holdings Parkview Nj Llc
Bought by
Nvr Inc
Create a Home Valuation Report for This Property
The Home Valuation Report is an in-depth analysis detailing your home's value as well as a comparison with similar homes in the area
Home Values in the Area
Average Home Value in this Area
Purchase History
| Date | Buyer | Sale Price | Title Company |
|---|---|---|---|
| Ruvelas Billy G | $360,275 | Legacy Title Agency Llc | |
| Nvr Inc | $165,000 | Title America Agency Corp |
Source: Public Records
Mortgage History
| Date | Status | Borrower | Loan Amount |
|---|---|---|---|
| Open | Ruvelas Billy G | $287,200 |
Source: Public Records
Tax History
| Year | Tax Paid | Tax Assessment Tax Assessment Total Assessment is a certain percentage of the fair market value that is determined by local assessors to be the total taxable value of land and additions on the property. | Land | Improvement |
|---|---|---|---|---|
| 2025 | $8,303 | $621,300 | $267,700 | $353,600 |
| 2024 | $8,340 | $577,000 | $227,700 | $349,300 |
| 2023 | $8,340 | $546,500 | $200,000 | $346,500 |
| 2022 | $8,164 | $475,700 | $135,000 | $340,700 |
| 2021 | $8,164 | $423,900 | $140,000 | $283,900 |
| 2020 | $8,191 | $410,600 | $130,000 | $280,600 |
| 2019 | $7,811 | $392,100 | $110,000 | $282,100 |
| 2018 | $7,600 | $380,400 | $110,000 | $270,400 |
| 2017 | $7,684 | $375,000 | $110,000 | $265,000 |
| 2016 | $7,778 | $371,100 | $110,000 | $261,100 |
| 2015 | $7,392 | $357,100 | $100,000 | $257,100 |
| 2014 | $7,574 | $350,000 | $100,000 | $250,000 |
Source: Public Records
Map
Nearby Homes
Your Personal Tour Guide
Ask me questions while you tour the home.