
E
Seller's Agent in 2026
Edward Loiko
Olde New England Realty
(413) 537-5370
1 in this area
14 Total Sales
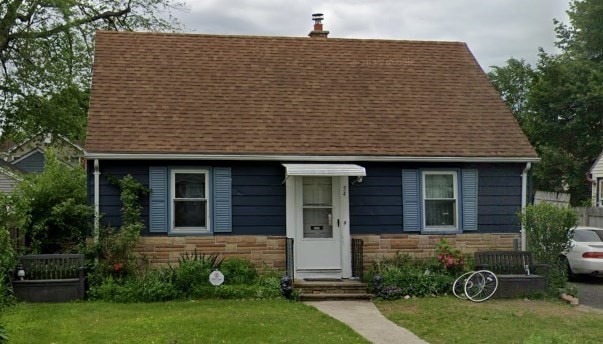
Finishing touches of rehab now going happening on this property. Fresh paint and carpet throughout the house.. In-law apartment in the basement.. Seller willing to help with closing costs in order to get. Property under contract quickly. Call today and schedule your appointment.
We collect this data history from publicly available records. To have your information removed, we recommend requesting removal directly through your county’s website.
| Date | Type | Sale Price | Title Company |
|---|---|---|---|
| Fiduciary Deed | $279,900 | -- | |
| Deed | $63,000 | -- |
We collect this data history from publicly available records. To have your information removed, we recommend requesting removal directly through your county’s website.
| Date | Status | Loan Amount | Loan Type |
|---|---|---|---|
| Open | $274,829 | Purchase Money Mortgage | |
| Previous Owner | $69,000 | No Value Available | |
| Previous Owner | $59,850 | Purchase Money Mortgage |
| Date | Event | Price | List to Sale | Price per Sq Ft |
|---|---|---|---|---|
| 03/13/2026 03/13/26 | Sold | $279,900 | +5.7% | $205 / Sq Ft |
| 11/26/2025 11/26/25 | Pending | -- | -- | -- |
| 11/19/2025 11/19/25 | For Sale | $264,900 | -- | $194 / Sq Ft |
| Year | Tax Paid | Tax Assessment Tax Assessment Total Assessment is a certain percentage of the fair market value that is determined by local assessors to be the total taxable value of land and additions on the property. | Land | Improvement |
|---|---|---|---|---|
| 2025 | $2,633 | $167,900 | $39,800 | $128,100 |
| 2024 | $2,769 | $172,400 | $33,100 | $139,300 |
| 2023 | $2,825 | $165,700 | $30,100 | $135,600 |
| 2022 | $2,753 | $146,300 | $28,200 | $118,100 |
| 2021 | $2,361 | $124,900 | $25,600 | $99,300 |
| 2020 | $2,244 | $114,900 | $25,600 | $89,300 |
| 2019 | $1,937 | $98,400 | $25,600 | $72,800 |
| 2018 | $1,962 | $99,700 | $25,600 | $74,100 |
| 2017 | $1,954 | $99,400 | $23,700 | $75,700 |
| 2016 | $1,726 | $87,800 | $23,700 | $64,100 |
| 2015 | $1,686 | $85,700 | $23,700 | $62,000 |
E
Seller's Agent in 2026
Edward Loiko
Olde New England Realty
(413) 537-5370
1 in this area
14 Total Sales
D
Buyer's Agent in 2026
Davone Mullen
Berkshire Hathaway HomeServices Realty Professionals
(413) 596-6711
2 in this area
7 Total Sales
Source: MLS Property Information Network (MLS PIN)
MLS Number: 73456472
APN: SPRI-010725-000000-000010
Disclaimer: Certain information contained herein is derived from information provided by parties other than Homes.com. All information provided is deemed reliable, but is not guaranteed to be accurate and should be independently verified.
![]() The property listing data and information, or the Images, set forth herein were provided to MLS Property Information Network, Inc. from third party sources, including sellers, lessors and public records, and were compiled by MLS Property Information Network, Inc. The property listing data and information, and the Images, are for the personal, non-commercial use of consumers having a good faith interest in purchasing or leasing listed properties of the type displayed to them and may not be used for any purpose other than to identify prospective properties which such consumers may have a good faith interest in purchasing or leasing. MLS Property Information Network, Inc. and its subscribers disclaim any and all representations and warranties as to the accuracy of the property listing data and information, or as to the accuracy of any of the Images, set forth herein.
The property listing data and information, or the Images, set forth herein were provided to MLS Property Information Network, Inc. from third party sources, including sellers, lessors and public records, and were compiled by MLS Property Information Network, Inc. The property listing data and information, and the Images, are for the personal, non-commercial use of consumers having a good faith interest in purchasing or leasing listed properties of the type displayed to them and may not be used for any purpose other than to identify prospective properties which such consumers may have a good faith interest in purchasing or leasing. MLS Property Information Network, Inc. and its subscribers disclaim any and all representations and warranties as to the accuracy of the property listing data and information, or as to the accuracy of any of the Images, set forth herein.
Ask me questions while you tour the home.