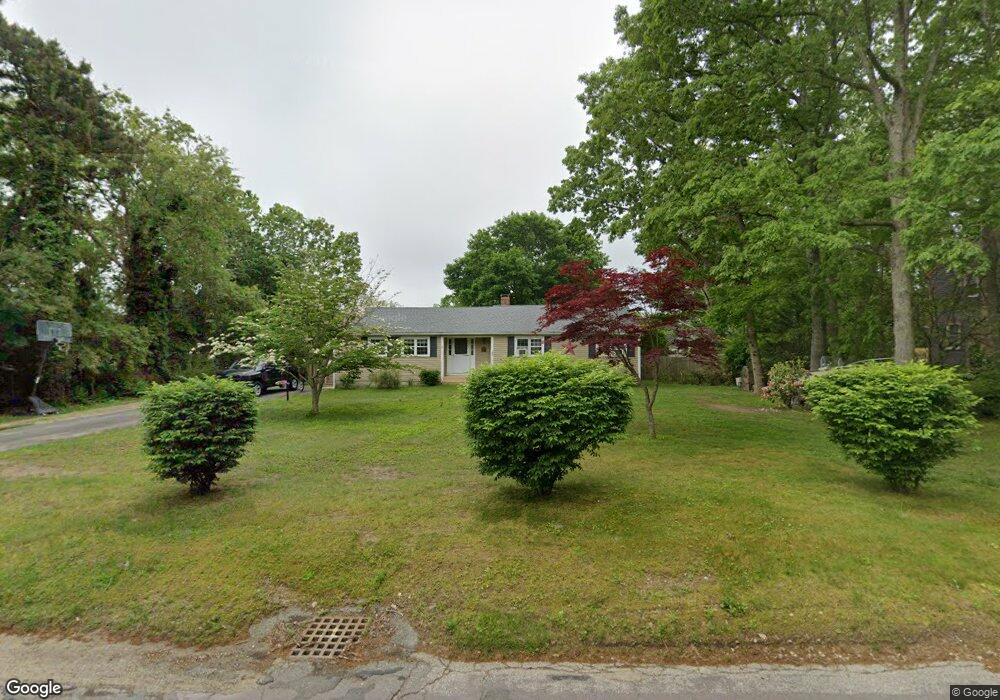
54 Windsor Rd Sandwich, MA 02563
Estimated Value: $568,425 - $630,000
3
Beds
2
Baths
1,406
Sq Ft
$425/Sq Ft
Est. Value
About This Home
This home is located at 54 Windsor Rd, Sandwich, MA 02563 and is currently estimated at $597,106, approximately $424 per square foot. 54 Windsor Rd is a home located in Barnstable County with nearby schools including Sandwich Middle High School, Sandwich Montessori School, and Riverview School.
Ownership History
Date
Name
Owned For
Owner Type
Purchase Details
Closed on
Feb 1, 2007
Sold by
Mac Rt and Mccusker Margaret R
Bought by
Varao 3Rd John M and Varao Keri L
Current Estimated Value
Home Financials for this Owner
Home Financials are based on the most recent Mortgage that was taken out on this home.
Original Mortgage
$226,400
Outstanding Balance
$135,604
Interest Rate
6.16%
Mortgage Type
Purchase Money Mortgage
Estimated Equity
$461,502
Purchase Details
Closed on
Feb 9, 2004
Sold by
Mccusker Margaret R
Bought by
Mac Rt and Mccusker James M
Create a Home Valuation Report for This Property
The Home Valuation Report is an in-depth analysis detailing your home's value as well as a comparison with similar homes in the area
Purchase History
We collect this data history from publicly available records. To have your information removed, we recommend requesting removal directly through your county’s website.
| Date | Buyer | Sale Price | Title Company |
|---|---|---|---|
| Varao 3Rd John M | $283,000 | -- | |
| Mac Rt | -- | -- |
Source: Public Records
Mortgage History
We collect this data history from publicly available records. To have your information removed, we recommend requesting removal directly through your county’s website.
| Date | Status | Borrower | Loan Amount |
|---|---|---|---|
| Open | Varao 3Rd John M | $226,400 | |
| Closed | Varao 3Rd John M | $56,600 |
Source: Public Records
Tax History
| Year | Tax Paid | Tax Assessment Tax Assessment Total Assessment is a certain percentage of the fair market value that is determined by local assessors to be the total taxable value of land and additions on the property. | Land | Improvement |
|---|---|---|---|---|
| 2025 | $4,823 | $456,300 | $177,200 | $279,100 |
| 2024 | $4,554 | $421,700 | $158,200 | $263,500 |
| 2023 | $4,453 | $387,200 | $143,800 | $243,400 |
| 2022 | $4,278 | $325,100 | $128,400 | $196,700 |
| 2021 | $4,117 | $299,000 | $123,400 | $175,600 |
| 2020 | $4,110 | $287,200 | $120,600 | $166,600 |
| 2019 | $3,792 | $264,800 | $118,400 | $146,400 |
| 2018 | $3,581 | $250,600 | $114,300 | $136,300 |
| 2017 | $3,555 | $238,100 | $110,600 | $127,500 |
| 2016 | $3,400 | $235,000 | $109,500 | $125,500 |
| 2015 | $3,263 | $220,200 | $98,600 | $121,600 |
Source: Public Records
Map
Nearby Homes
- 17 Kensington Dr
- 9 Avon Dr
- 28 Buckingham Dr
- 5 Nottingham Dr
- 128 Quaker Meeting House Rd
- 38 Kiahs Way
- 8 Telegraph Hill Rd
- 204 Farmersville Rd
- 42 Pond View Dr
- 83 Greenville Dr
- 10 Quaker Meetinghouse Rd
- 3 Whiffletree Cir
- 185 Cotuit Rd Unit BE4
- 185 Cotuit Rd Unit HL15
- 185 Cotuit Rd Unit JP1
- 185 Cotuit Rd Unit C5 Aspen
- 117 Massachusetts 130 Unit 1
- 2 Marie Ln
- 28 Chipman Rd
- 25 Manor Dr
Your Personal Tour Guide
Ask me questions while you tour the home.