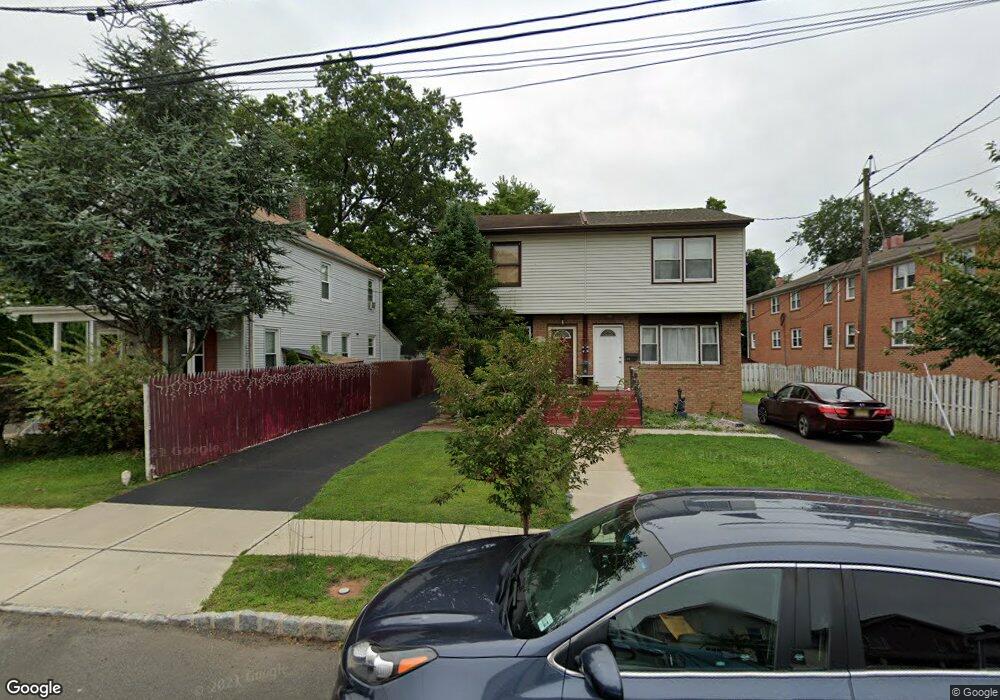
540 E 2nd St Bound Brook, NJ 08805
Estimated Value: $408,341 - $457,000
About This Home
This home is located at 540 E 2nd St, Bound Brook, NJ 08805 and is currently estimated at $431,835, approximately $380 per square foot. 540 E 2nd St is a home located in Somerset County with nearby schools including LaMonte Annex Elementary School, Lafayette Elementary School, and Bound Brook High School.
Ownership History
We collect this data history from publicly available records. To have your information removed, we recommend requesting removal directly through your county’s website.
Purchase Details
Purchase Details
Home Financials for this Owner
Home Financials are based on the most recent Mortgage that was taken out on this home.Home Values in the Area
Average Home Value in this Area
Purchase History
We collect this data history from publicly available records. To have your information removed, we recommend requesting removal directly through your county’s website.
| Date | Buyer | Sale Price | Title Company |
|---|---|---|---|
| -- | None Listed On Document | ||
| $94,500 | -- |
Mortgage History
We collect this data history from publicly available records. To have your information removed, we recommend requesting removal directly through your county’s website.
| Date | Status | Borrower | Loan Amount |
|---|---|---|---|
| Previous Owner | $90,000 |
Tax History
We collect this data history from publicly available records. To have your information removed, we recommend requesting removal directly through your county’s website.
| Year | Tax Paid | Tax Assessment Tax Assessment Total Assessment is a certain percentage of the fair market value that is determined by local assessors to be the total taxable value of land and additions on the property. | Land | Improvement |
|---|---|---|---|---|
| 2025 | $7,665 | $315,400 | $173,500 | $141,900 |
| 2024 | $7,665 | $337,800 | $153,500 | $184,300 |
| 2023 | $7,444 | $315,700 | $133,500 | $182,200 |
| 2022 | $7,317 | $294,100 | $118,500 | $175,600 |
| 2021 | $5,441 | $245,300 | $98,500 | $146,800 |
| 2020 | $6,106 | $197,800 | $63,500 | $134,300 |
| 2019 | $5,441 | $168,100 | $53,500 | $114,600 |
| 2018 | $5,118 | $153,500 | $43,500 | $110,000 |
| 2017 | $5,157 | $151,200 | $43,500 | $107,700 |
| 2016 | $4,537 | $134,000 | $23,500 | $110,500 |
| 2015 | $4,159 | $125,600 | $18,500 | $107,100 |
| 2014 | $4,306 | $125,600 | $18,500 | $107,100 |
Map
- 410 E Main St
- 224 E 2nd St
- 507 E Union Ave
- 34 Church St
- 39 Liberty Way
- 3 E High St
- 24 Swing Bridge Ln
- 17 Talmage Ave
- 23 Patriots Path
- 7 Patriots Path Unit 813
- 27 Patriots Path
- 28 W Union Ave
- 151 Beechwood Ave
- 17 Swing Bridge Ln Unit 115
- 125 Linden Ave
- 221 Prospect St
- 11 Franklin St
- 520 Winsor St
- 261 Beechwood Ave
- 50 Canal St
Ask me questions while you tour the home.