542 Main St Stoneham, MA 02180
Haywardville NeighborhoodEstimated Value: $817,000 - $904,000
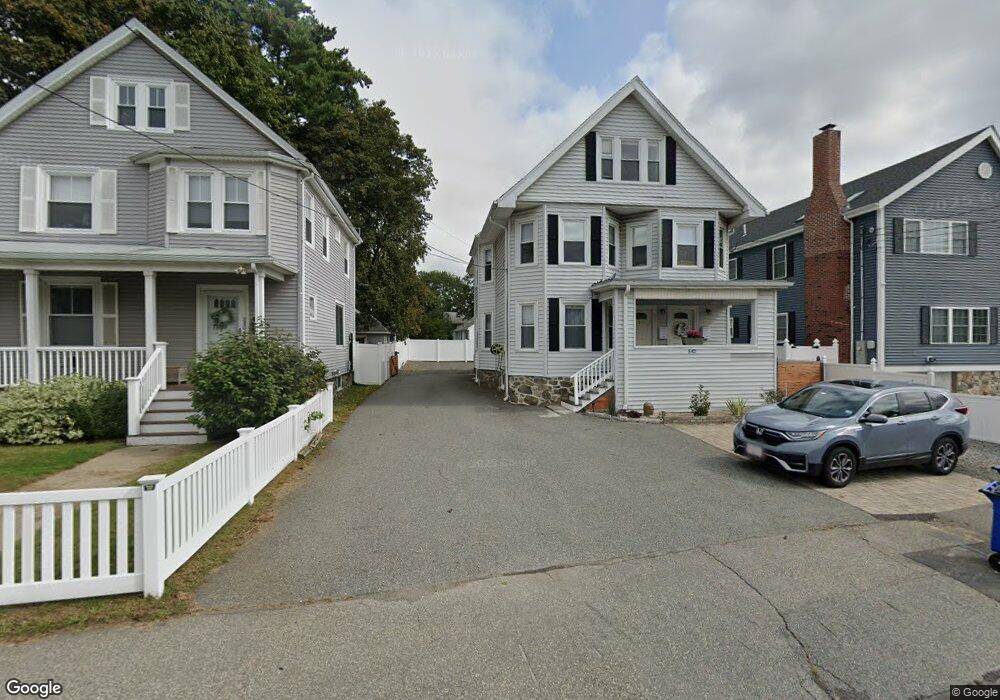
About This Home
This home is located at 542 Main St, Stoneham, MA 02180 and is currently estimated at $858,890, approximately $345 per square foot. 542 Main St is a home located in Middlesex County with nearby schools including Stoneham High School, St. Patrick Elementary School, and Greater Boston Academy.
Ownership History
We collect this data history from publicly available records. To have your information removed, we recommend requesting removal directly through your county’s website.
Purchase Details
Purchase Details
Home Financials for this Owner
Home Financials are based on the most recent Mortgage that was taken out on this home.Home Values in the Area
Average Home Value in this Area
Purchase History
We collect this data history from publicly available records. To have your information removed, we recommend requesting removal directly through your county’s website.
| Date | Buyer | Sale Price | Title Company |
|---|---|---|---|
| $376,000 | None Available | ||
| $188,000 | -- | ||
| $188,000 | -- |
Mortgage History
We collect this data history from publicly available records. To have your information removed, we recommend requesting removal directly through your county’s website.
| Date | Status | Borrower | Loan Amount |
|---|---|---|---|
| Previous Owner | $230,000 | ||
| Previous Owner | $149,000 | ||
| Previous Owner | $150,400 |
Tax History
We collect this data history from publicly available records. To have your information removed, we recommend requesting removal directly through your county’s website.
| Year | Tax Paid | Tax Assessment Tax Assessment Total Assessment is a certain percentage of the fair market value that is determined by local assessors to be the total taxable value of land and additions on the property. | Land | Improvement |
|---|---|---|---|---|
| 2025 | $7,916 | $773,800 | $344,400 | $429,400 |
| 2024 | $7,911 | $747,000 | $317,200 | $429,800 |
| 2023 | $7,781 | $701,000 | $290,000 | $411,000 |
| 2022 | $6,917 | $664,500 | $262,900 | $401,600 |
| 2021 | $6,784 | $627,000 | $226,600 | $400,400 |
| 2020 | $6,302 | $584,100 | $213,000 | $371,100 |
| 2019 | $5,949 | $530,200 | $203,500 | $326,700 |
| 2018 | $5,941 | $525,500 | $195,300 | $330,200 |
| 2017 | $5,278 | $442,900 | $170,000 | $272,900 |
| 2016 | $5,302 | $417,500 | $170,000 | $247,500 |
| 2015 | $4,997 | $385,600 | $153,000 | $232,600 |
| 2014 | $4,543 | $336,800 | $136,000 | $200,800 |
Map
- 7 Carol St
- 50 Marble St
- 12 Benton St Unit 4
- 20 Murdock Rd
- 597 Main St Unit B6
- 222 Park St
- 472 Main St Unit C
- 193 Park St
- 14 Katherine Rd
- 6-8 South St Unit 2
- 146 Marble St Unit 404
- 99 Park St Unit 101
- 426 Main St Unit 205
- 26 Maple St Unit B
- 40 Wright St
- 6 Minot St
- 7 Pine St
- 159 Franklin St Unit E6
- 4 Stratton Dr Unit 308
- 24 Montvale Ave
Ask me questions while you tour the home.