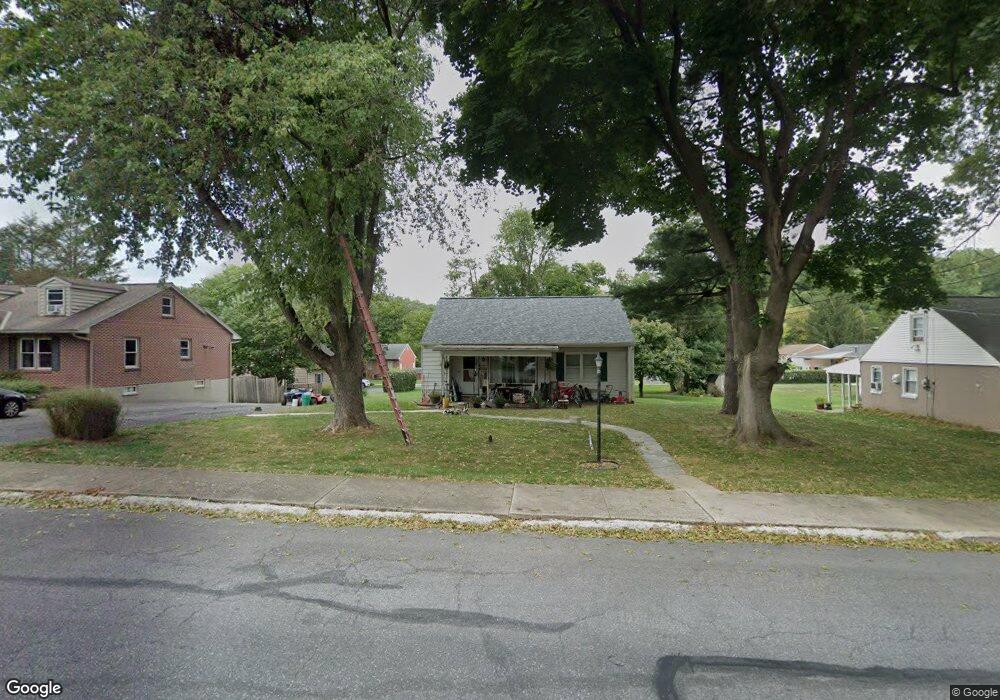
543 Maple St Columbia, PA 17512
Estimated Value: $253,000 - $292,000
3
Beds
1
Bath
1,032
Sq Ft
$268/Sq Ft
Est. Value
About This Home
This home is located at 543 Maple St, Columbia, PA 17512 and is currently estimated at $276,067, approximately $267 per square foot. 543 Maple St is a home located in Lancaster County with nearby schools including Columbia Middle School, Columbia High School, and Our Lady of the Angels School.
Ownership History
Date
Name
Owned For
Owner Type
Purchase Details
Closed on
Jun 9, 2010
Sold by
Nikolaus Barbara Ann and Roth Elva M
Bought by
Rineer Michael T
Current Estimated Value
Home Financials for this Owner
Home Financials are based on the most recent Mortgage that was taken out on this home.
Original Mortgage
$113,964
Outstanding Balance
$76,902
Interest Rate
5.11%
Mortgage Type
FHA
Estimated Equity
$199,165
Purchase Details
Closed on
Jul 20, 2009
Sold by
Nikolaus Barbara A
Bought by
Roth Elva M
Purchase Details
Closed on
Jan 3, 2008
Sold by
Roth Elva M
Bought by
Nikolaus Barbara A
Create a Home Valuation Report for This Property
The Home Valuation Report is an in-depth analysis detailing your home's value as well as a comparison with similar homes in the area
Home Values in the Area
Average Home Value in this Area
Purchase History
| Date | Buyer | Sale Price | Title Company |
|---|---|---|---|
| Rineer Michael T | $115,500 | None Available | |
| Roth Elva M | -- | None Available | |
| Nikolaus Barbara A | -- | None Available |
Source: Public Records
Mortgage History
| Date | Status | Borrower | Loan Amount |
|---|---|---|---|
| Open | Rineer Michael T | $113,964 |
Source: Public Records
Tax History
| Year | Tax Paid | Tax Assessment Tax Assessment Total Assessment is a certain percentage of the fair market value that is determined by local assessors to be the total taxable value of land and additions on the property. | Land | Improvement |
|---|---|---|---|---|
| 2025 | $4,810 | $128,700 | $49,100 | $79,600 |
| 2024 | $4,810 | $128,700 | $49,100 | $79,600 |
| 2023 | $4,810 | $128,700 | $49,100 | $79,600 |
| 2022 | $4,810 | $128,700 | $49,100 | $79,600 |
| 2021 | $4,810 | $128,700 | $49,100 | $79,600 |
| 2020 | $4,810 | $128,700 | $49,100 | $79,600 |
| 2019 | $4,727 | $128,700 | $49,100 | $79,600 |
| 2018 | $5,110 | $128,700 | $49,100 | $79,600 |
| 2017 | $3,762 | $91,600 | $28,600 | $63,000 |
| 2016 | $3,762 | $91,600 | $28,600 | $63,000 |
| 2015 | $1,075 | $91,600 | $28,600 | $63,000 |
| 2014 | $2,282 | $91,600 | $28,600 | $63,000 |
Source: Public Records
Map
Nearby Homes
Your Personal Tour Guide
Ask me questions while you tour the home.