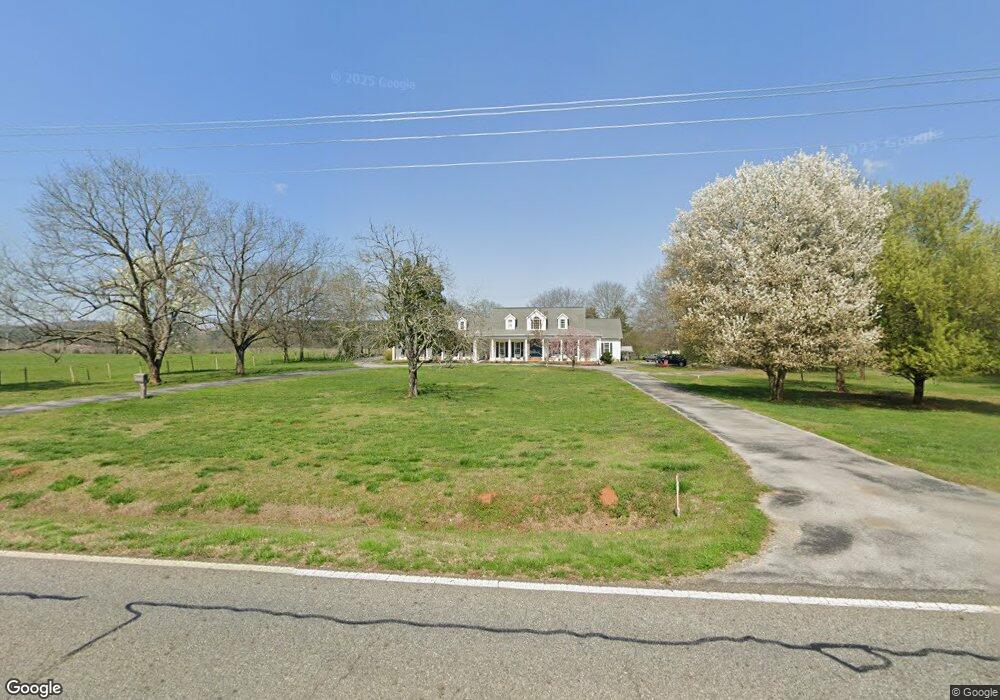
5436 Cave Spring Rd SW Cave Spring, GA 30124
Estimated Value: $496,000 - $627,000
Studio
--
Bath
4,315
Sq Ft
$129/Sq Ft
Est. Value
About This Home
This home is located at 5436 Cave Spring Rd SW, Cave Spring, GA 30124 and is currently estimated at $556,616, approximately $128 per square foot. 5436 Cave Spring Rd SW is a home located in Floyd County with nearby schools including Coosa Middle School and Coosa High School.
Ownership History
Date
Name
Owned For
Owner Type
Purchase Details
Closed on
Nov 1, 2004
Sold by
Ingram Ralph R and Barbara Ingram
Bought by
Bramlette Rhonda Ruthell
Current Estimated Value
Purchase Details
Closed on
Oct 25, 2001
Sold by
Morgan Sara Cook
Bought by
Cook Frank Trustee For Sara Cook Morgan
Purchase Details
Closed on
Oct 19, 2001
Sold by
Cook Frank Trustee For Sara Cook Morgan
Bought by
Ingram Ralph R and Barbara Ingram
Purchase Details
Closed on
May 1, 1995
Sold by
Cook Frank Trustee For Sara Cook Morgan
Bought by
Morgan Sara Cook
Purchase Details
Closed on
Mar 27, 1972
Sold by
Morgan Jackson D
Bought by
Cook Frank Trustee For Sara Cook Morgan
Purchase Details
Closed on
Mar 23, 1972
Sold by
Morgan John S
Bought by
Morgan Jackson D
Purchase Details
Closed on
Jul 26, 1967
Sold by
Morgan Jackson Davis
Bought by
Morgan John S
Purchase Details
Closed on
Mar 5, 1964
Bought by
Morgan Jackson Davis
Create a Home Valuation Report for This Property
The Home Valuation Report is an in-depth analysis detailing your home's value as well as a comparison with similar homes in the area
Purchase History
| Date | Buyer | Sale Price | Title Company |
|---|---|---|---|
| Bramlette Rhonda Ruthell | -- | -- | |
| Cook Frank Trustee For Sara Cook Morgan | -- | -- | |
| Ingram Ralph R | $45,000 | -- | |
| Morgan Sara Cook | -- | -- | |
| Cook Frank Trustee For Sara Cook Morgan | -- | -- | |
| Morgan Jackson D | -- | -- | |
| Morgan John S | -- | -- | |
| Morgan Jackson Davis | -- | -- |
Source: Public Records
Tax History
| Year | Tax Paid | Tax Assessment Tax Assessment Total Assessment is a certain percentage of the fair market value that is determined by local assessors to be the total taxable value of land and additions on the property. | Land | Improvement |
|---|---|---|---|---|
| 2025 | $4,528 | $222,700 | $18,712 | $203,988 |
| 2024 | $4,528 | $220,970 | $16,632 | $204,338 |
| 2023 | $4,396 | $196,978 | $15,120 | $181,858 |
| 2022 | $3,578 | $165,630 | $11,995 | $153,635 |
| 2021 | $3,374 | $151,060 | $10,910 | $140,150 |
| 2020 | $3,275 | $144,083 | $9,487 | $134,596 |
| 2019 | $3,126 | $138,431 | $9,487 | $128,944 |
| 2018 | $3,017 | $132,160 | $9,036 | $123,124 |
| 2017 | $2,874 | $124,098 | $8,366 | $115,732 |
| 2016 | $2,874 | $122,210 | $8,360 | $113,850 |
| 2015 | $2,781 | $122,210 | $8,360 | $113,850 |
| 2014 | $2,781 | $122,210 | $8,360 | $113,850 |
Source: Public Records
Map
Nearby Homes
- 0 Booger Hollow Rd SW Unit 17969096
- 475 Davis Rd SW
- 0 Blacks Bluff Rd SW Unit 17015073
- 47 Boyd Rd SW
- 262 Blacks Bluff Rd SW
- 0 Old Blacks Bluff Rd SW Unit 10652523
- 4458 Old Blacks Bluff Rd SW
- 0 Booger Hollow Rd
- 0 College View Dr SW Unit 10655489
- 0 College View Dr SW Unit 10655483
- 4803 Cedartown Hwy SE
- 938 Marion Dairy Rd
- 3428 Horseleg Creek Rd SW
- 0 Vanns Valley Rd SW Unit 7589183
- 5854 Cedartown Hwy SW
- 0 Doyle Rd Unit 26660497
- 65 Vanns Valley Rd SW
- 5866 Hwy 27 S
- 1039 Livingston Rd SW
- 185 Marion Dairy Rd SE
- 5300 Cave Spring Rd SW
- 5360 Cave Spring Rd SW
- 5360 Cave Spring Rd SW
- 0000 Morgan Dairy Rd SW
- 5587 Cave Spring Rd SW Unit B
- 5587 Cave Spring Rd SW
- 5614 Cave Spring Rd SW
- 5555 Cave Spring Rd SW
- 5627 Cave Spring Rd SW
- 5665 Cave Spring Rd SW
- 132 Morgan Dairy Rd SW
- 300 Webb Creek Rd SW
- 421 Cunningham Rd SW
- 413B Cunningham Rd SW
- 450 Webb Creek Rd SW
- 453 Cunningham Rd SW
- 496 Morgan Dairy Rd SW
- 496 Morgan Dairy Rd SW
- 496 Morgan Dairy Rd SW
- 515 Morgan Dairy Rd SW
Your Personal Tour Guide
Ask me questions while you tour the home.