Estimated Value: $271,000 - $295,000
About This Home
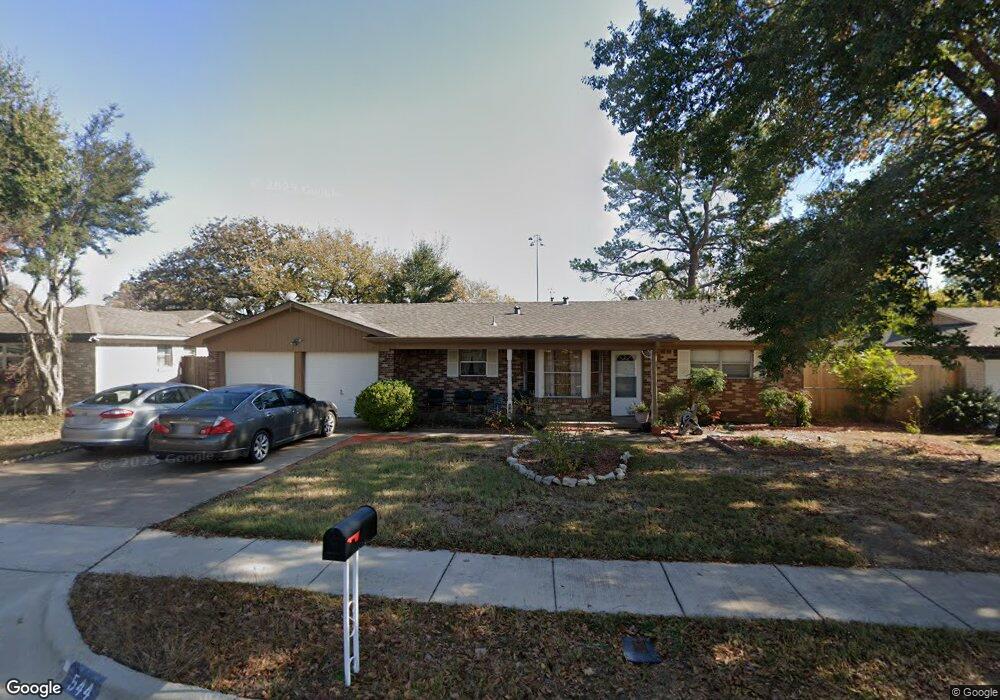
This home is located at 544 E Redbud Dr, Hurst, TX 76053 and is currently estimated at $286,022, approximately $186 per square foot. 544 E Redbud Dr is a home located in Tarrant County with nearby schools including Bellaire Elementary School, Hurst J High School, and L.D. Bell High School.
Ownership History
We collect this data history from publicly available records. To have your information removed, we recommend requesting removal directly through your county’s website.
Purchase Details
Home Financials for this Owner
Home Financials are based on the most recent Mortgage that was taken out on this home.Home Values in the Area
Average Home Value in this Area
Purchase History
We collect this data history from publicly available records. To have your information removed, we recommend requesting removal directly through your county’s website.
| Date | Buyer | Sale Price | Title Company |
|---|---|---|---|
| -- | Alamo Title Co |
Mortgage History
We collect this data history from publicly available records. To have your information removed, we recommend requesting removal directly through your county’s website.
| Date | Status | Borrower | Loan Amount |
|---|---|---|---|
| Open | $78,937 |
Tax History
We collect this data history from publicly available records. To have your information removed, we recommend requesting removal directly through your county’s website.
| Year | Tax Paid | Tax Assessment Tax Assessment Total Assessment is a certain percentage of the fair market value that is determined by local assessors to be the total taxable value of land and additions on the property. | Land | Improvement |
|---|---|---|---|---|
| 2025 | $558 | $221,246 | -- | -- |
| 2024 | $551 | $261,018 | $55,000 | $206,018 |
| 2023 | $3,663 | $254,060 | $40,000 | $214,060 |
| 2022 | $3,827 | $239,059 | $40,000 | $199,059 |
| 2021 | $3,645 | $185,890 | $40,000 | $145,890 |
| 2020 | $3,305 | $164,000 | $40,000 | $124,000 |
| 2019 | $3,057 | $172,145 | $40,000 | $132,145 |
| 2018 | $1,036 | $113,534 | $19,000 | $94,534 |
| 2017 | $2,612 | $149,350 | $19,000 | $130,350 |
| 2016 | $2,374 | $123,774 | $19,000 | $104,774 |
| 2015 | $1,859 | $85,300 | $17,000 | $68,300 |
| 2014 | $1,859 | $85,300 | $17,000 | $68,300 |
Map
- 540 E Redbud Dr
- 548 E Redbud Dr
- 536 E Redbud Dr
- 537 E Redbud Dr
- 533 E Redbud Dr
- 329 Tanglewood Dr
- 529 E Redbud Dr
- 532 E Redbud Dr
- 333 Tanglewood Dr
- 316 Tanglewood Dr
- 325 Tanglewood Dr
- 321 Tanglewood Dr
- 525 E Redbud Dr
- 528 E Redbud Dr
- 312 Tanglewood Dr
- 317 Tanglewood Dr
- 520 Brown Trail Ct
- 521 E Redbud Dr
- 501 Greenway Dr
- 516 Brown Trail Ct
Ask me questions while you tour the home.