545 Cypress Rd Newington, CT 06111
Estimated Value: $256,000 - $272,000
About This Home
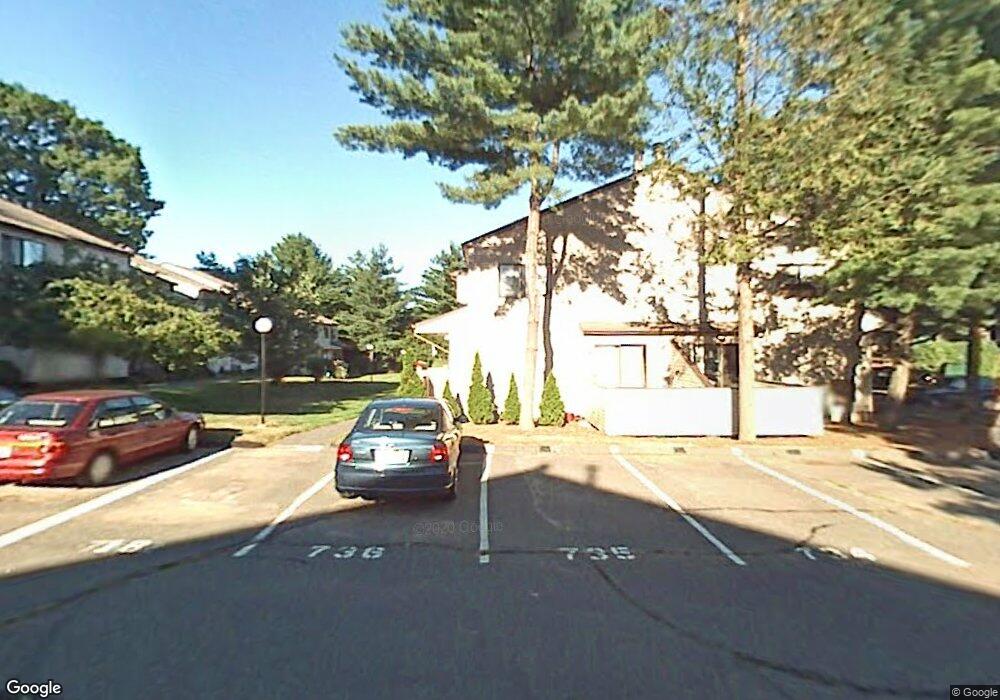
This home is located at 545 Cypress Rd, Newington, CT 06111 and is currently estimated at $264,254, approximately $192 per square foot. 545 Cypress Rd is a home located in Hartford County with nearby schools including Ruth Chaffee School, John Wallace Middle School, and Newington High School.
Ownership History
We collect this data history from publicly available records. To have your information removed, we recommend requesting removal directly through your county’s website.
Purchase Details
Purchase Details
Purchase Details
Purchase Details
Home Financials for this Owner
Home Financials are based on the most recent Mortgage that was taken out on this home.Purchase Details
Purchase Details
Home Values in the Area
Average Home Value in this Area
Purchase History
We collect this data history from publicly available records. To have your information removed, we recommend requesting removal directly through your county’s website.
| Date | Buyer | Sale Price | Title Company |
|---|---|---|---|
| -- | -- | ||
| $115,000 | -- | ||
| $77,500 | -- | ||
| $78,500 | -- | ||
| $86,000 | -- | ||
| $117,500 | -- |
Mortgage History
We collect this data history from publicly available records. To have your information removed, we recommend requesting removal directly through your county’s website.
| Date | Status | Borrower | Loan Amount |
|---|---|---|---|
| Previous Owner | $99,000 | ||
| Previous Owner | $113,359 | ||
| Previous Owner | $76,700 | ||
| Previous Owner | $30,000 |
Tax History
We collect this data history from publicly available records. To have your information removed, we recommend requesting removal directly through your county’s website.
| Year | Tax Paid | Tax Assessment Tax Assessment Total Assessment is a certain percentage of the fair market value that is determined by local assessors to be the total taxable value of land and additions on the property. | Land | Improvement |
|---|---|---|---|---|
| 2025 | $3,909 | $97,780 | $0 | $97,780 |
| 2024 | $3,879 | $97,780 | $0 | $97,780 |
| 2023 | $3,751 | $97,780 | $0 | $97,780 |
| 2022 | $3,764 | $97,780 | $0 | $97,780 |
| 2021 | $3,795 | $97,780 | $0 | $97,780 |
| 2020 | $3,889 | $99,000 | $0 | $99,000 |
| 2019 | $3,906 | $99,000 | $0 | $99,000 |
| 2018 | $3,812 | $99,000 | $0 | $99,000 |
| 2017 | $3,622 | $99,000 | $0 | $99,000 |
| 2016 | $3,539 | $99,000 | $0 | $99,000 |
| 2014 | $3,630 | $104,390 | $0 | $104,390 |
Map
- 24 Pepper Bush Ln
- 94 Cottonwood Rd
- 167 Cypress Rd Unit 167
- 35 Woodsedge Dr Unit 3C
- 27 Cottonwood Rd
- 6 Vinnie Dr
- 21 Westmont Rd
- 47 Luca Ln
- 67 Luca Ln
- 61 Luca Ln
- 76 Luca Lane Homesite 8
- 563 Churchill Dr
- 21 Marshalls Meadows
- 17 School House Rd
- 179 Brockett St
- 15 Chaplin St
- 25 Amato Dr
- 501 Highland St
- 34 Wakeley Rd
- 2950 Berlin Turnpike
- 545 Cypress Rd Unit 545
- 543 Cypress Rd
- 543 Cypress Rd Unit 543
- 533 Cypress Rd
- 531 Cypress Rd
- 541 Cypress Rd
- 541 Cypress Rd Unit 541
- 529 Cypress Rd
- 529 Cypress Rd Unit 529
- 507 Cypress Rd
- 509 Cypress Rd
- 539 Cypress Rd
- 539 Cypress Rd Unit 539
- 505 Cypress Rd
- 505 Cypress Rd Unit 505
- 527 Cypress Rd
- 527 Cypress Rd Unit 527
- 519 Cypress Rd
- 519 Cypress Rd Unit 519
- 521 Cypress Rd
Ask me questions while you tour the home.