545 Maple Dr Streamwood, IL 60107
Estimated Value: $400,000 - $631,000
About This Home
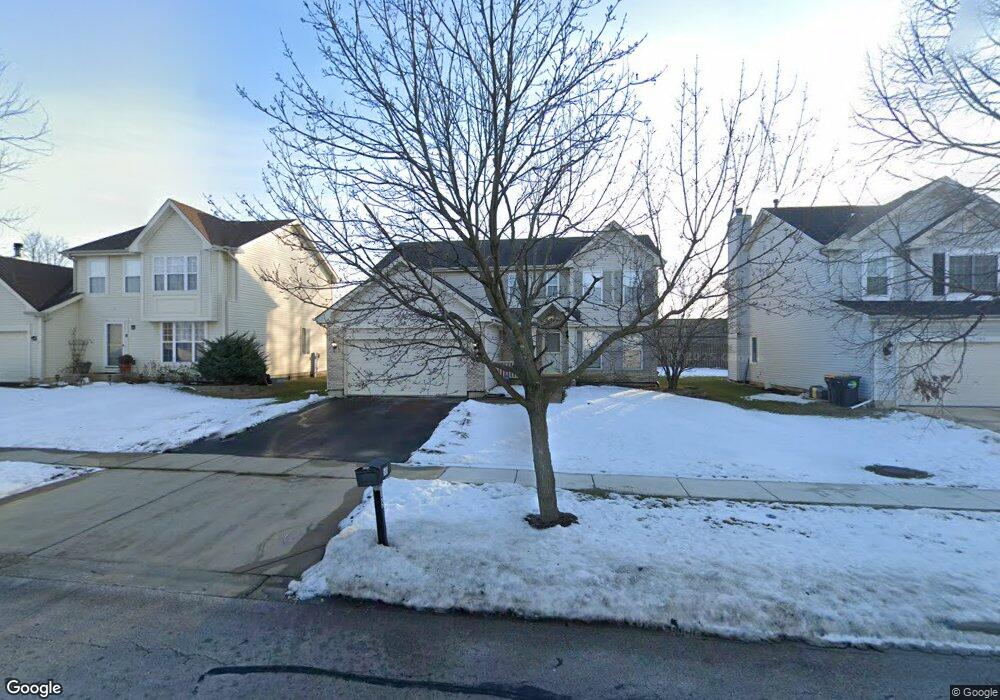
This home is located at 545 Maple Dr, Streamwood, IL 60107 and is currently estimated at $487,925, approximately $219 per square foot. 545 Maple Dr is a home located in Cook County with nearby schools including Heritage Elementary School, Tefft Middle School, and Streamwood High School.
Ownership History
We collect this data history from publicly available records. To have your information removed, we recommend requesting removal directly through your county’s website.
Purchase Details
Purchase Details
Purchase Details
Home Financials for this Owner
Home Financials are based on the most recent Mortgage that was taken out on this home.Home Values in the Area
Average Home Value in this Area
Purchase History
We collect this data history from publicly available records. To have your information removed, we recommend requesting removal directly through your county’s website.
| Date | Buyer | Sale Price | Title Company |
|---|---|---|---|
| -- | None Available | ||
| -- | -- | ||
| $205,500 | -- |
Mortgage History
We collect this data history from publicly available records. To have your information removed, we recommend requesting removal directly through your county’s website.
| Date | Status | Borrower | Loan Amount |
|---|---|---|---|
| Open | $164,000 |
Tax History
We collect this data history from publicly available records. To have your information removed, we recommend requesting removal directly through your county’s website.
| Year | Tax Paid | Tax Assessment Tax Assessment Total Assessment is a certain percentage of the fair market value that is determined by local assessors to be the total taxable value of land and additions on the property. | Land | Improvement |
|---|---|---|---|---|
| 2025 | $8,081 | $44,000 | $6,240 | $37,760 |
| 2024 | $8,081 | $32,000 | $5,460 | $26,540 |
| 2023 | $7,810 | $32,000 | $5,460 | $26,540 |
| 2022 | $7,810 | $32,000 | $5,460 | $26,540 |
| 2021 | $6,167 | $22,803 | $3,705 | $19,098 |
| 2020 | $7,104 | $22,803 | $3,705 | $19,098 |
| 2019 | $7,115 | $25,622 | $3,705 | $21,917 |
| 2018 | $7,617 | $24,999 | $3,315 | $21,684 |
| 2017 | $7,533 | $24,999 | $3,315 | $21,684 |
| 2016 | $7,308 | $24,999 | $3,315 | $21,684 |
| 2015 | $8,061 | $25,291 | $2,925 | $22,366 |
| 2014 | $7,957 | $25,291 | $2,925 | $22,366 |
| 2013 | $7,690 | $25,291 | $2,925 | $22,366 |
Map
- 439 E Morse Ave
- 1835 Mckool Ave
- 1851 Mckool Ave
- 6881 Hickory St
- 613 Wicker Ave
- 4096 Quincy Ct Unit 3
- 4028 Oxford Ct
- 110 N Chase Ave
- 2115 Cherry Ave
- 2110 Cherry Ave
- 204 N Elroy Ave
- 207 Locksley Dr
- 157 Peter Ct Unit B
- 916 Mulberry Ln
- 102 N Berteau Ave
- 335 David Ct Unit B
- 7410 East Ave
- 7341 East Ave
- 106 S Elroy Ave
- 194 Robert Ct Unit A
Ask me questions while you tour the home.