Estimated Value: $252,593 - $465,000
4
Beds
3
Baths
2,652
Sq Ft
$135/Sq Ft
Est. Value
About This Home
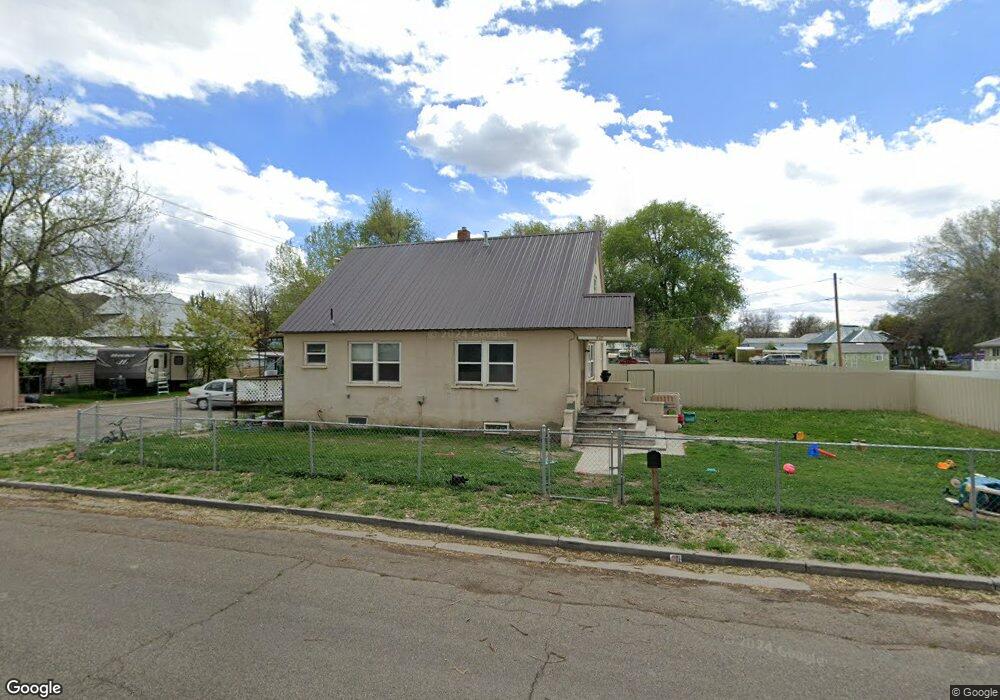
This home is located at 547 D St W, Vale, OR 97918 and is currently estimated at $358,797, approximately $135 per square foot. 547 D St W is a home located in Malheur County with nearby schools including Vale Middle School, Vale High School, and Mount Moriah Christian Academy.
Ownership History
Date
Name
Owned For
Owner Type
Purchase Details
Closed on
May 23, 2024
Sold by
Stowe Richard Leroy
Bought by
Evers Living Trust and Evers
Current Estimated Value
Purchase Details
Closed on
Feb 12, 2014
Sold by
Andrews Lana M
Bought by
Andrews Dan J and Andrews Lana Marie
Home Financials for this Owner
Home Financials are based on the most recent Mortgage that was taken out on this home.
Original Mortgage
$115,719
Interest Rate
4.49%
Mortgage Type
Purchase Money Mortgage
Purchase Details
Closed on
Jul 28, 2011
Sold by
Martin Ronald Dean and Martin Cindy L
Bought by
Deutsch Bank National Trust Co
Create a Home Valuation Report for This Property
The Home Valuation Report is an in-depth analysis detailing your home's value as well as a comparison with similar homes in the area
Purchase History
| Date | Buyer | Sale Price | Title Company |
|---|---|---|---|
| Evers Living Trust | $400,000 | Pioneer Title | |
| Andrews Dan J | -- | None Available | |
| Deutsch Bank National Trust Co | $23,222 | -- |
Source: Public Records
Mortgage History
| Date | Status | Borrower | Loan Amount |
|---|---|---|---|
| Previous Owner | Andrews Dan J | $115,719 |
Source: Public Records
Tax History
| Year | Tax Paid | Tax Assessment Tax Assessment Total Assessment is a certain percentage of the fair market value that is determined by local assessors to be the total taxable value of land and additions on the property. | Land | Improvement |
|---|---|---|---|---|
| 2025 | $2,474 | $136,600 | $17,027 | $119,573 |
| 2024 | $2,414 | $132,622 | $16,531 | $116,091 |
| 2023 | $2,337 | $128,760 | $17,438 | $111,322 |
| 2022 | $2,272 | $125,010 | $22,087 | $102,923 |
| 2021 | $2,275 | $121,369 | $24,190 | $97,179 |
| 2020 | $2,157 | $117,834 | $20,844 | $96,990 |
| 2019 | $1,972 | $114,402 | $21,713 | $92,689 |
| 2018 | $1,855 | $111,070 | $21,080 | $89,990 |
| 2017 | $1,821 | $109,804 | $21,514 | $88,290 |
| 2016 | $1,733 | $106,606 | $20,888 | $85,718 |
| 2015 | $1,763 | $103,501 | $19,955 | $83,546 |
| 2014 | $1,787 | $100,487 | $21,733 | $78,754 |
Source: Public Records
Map
Nearby Homes
Your Personal Tour Guide
Ask me questions while you tour the home.