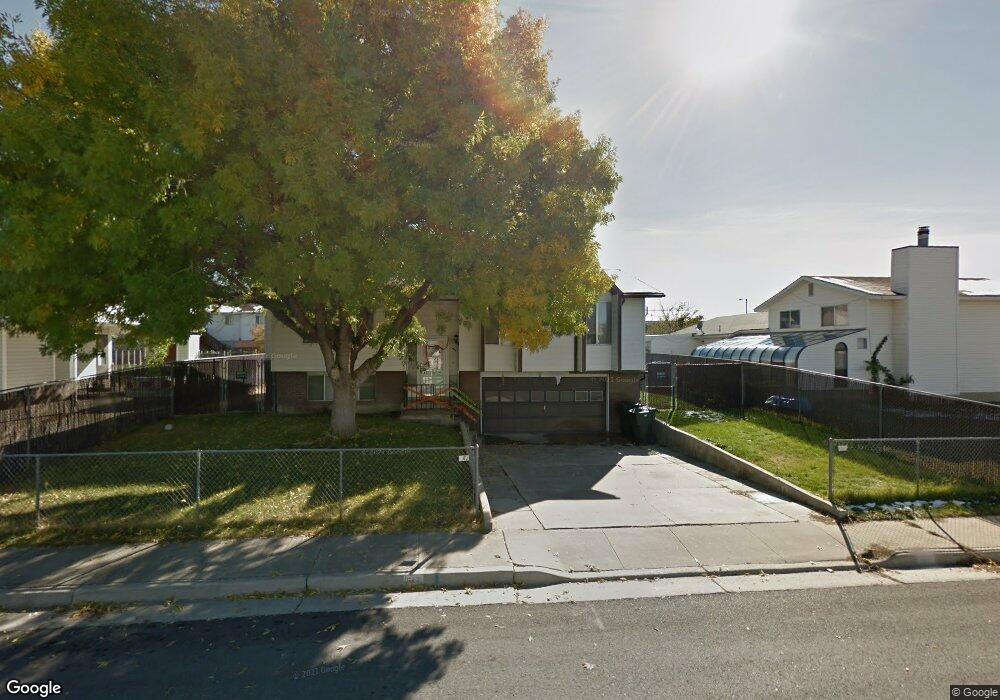
547 Havasu St Tooele, UT 84074
Estimated Value: $377,872 - $392,000
4
Beds
2
Baths
1,728
Sq Ft
$223/Sq Ft
Est. Value
About This Home
This home is located at 547 Havasu St, Tooele, UT 84074 and is currently estimated at $385,218, approximately $222 per square foot. 547 Havasu St is a home located in Tooele County with nearby schools including Northlake Elementary School, Tooele Junior High School, and Tooele High School.
Ownership History
Date
Name
Owned For
Owner Type
Purchase Details
Closed on
Apr 13, 2012
Sold by
Oldroyd Josie I
Bought by
Dickinson Andrew C
Current Estimated Value
Home Financials for this Owner
Home Financials are based on the most recent Mortgage that was taken out on this home.
Original Mortgage
$122,448
Outstanding Balance
$84,376
Interest Rate
3.86%
Mortgage Type
New Conventional
Estimated Equity
$300,842
Create a Home Valuation Report for This Property
The Home Valuation Report is an in-depth analysis detailing your home's value as well as a comparison with similar homes in the area
Purchase History
| Date | Buyer | Sale Price | Title Company |
|---|---|---|---|
| Dickinson Andrew C | -- | Inwest Title Services Inc | |
| Oldroyd Alan H | -- | Inwest Title Services Inc |
Source: Public Records
Mortgage History
| Date | Status | Borrower | Loan Amount |
|---|---|---|---|
| Open | Dickinson Andrew C | $122,448 |
Source: Public Records
Tax History
| Year | Tax Paid | Tax Assessment Tax Assessment Total Assessment is a certain percentage of the fair market value that is determined by local assessors to be the total taxable value of land and additions on the property. | Land | Improvement |
|---|---|---|---|---|
| 2025 | $2,379 | $360,765 | $100,000 | $260,765 |
| 2024 | $2,605 | $198,820 | $55,000 | $143,820 |
| 2023 | $2,605 | $195,339 | $52,383 | $142,956 |
| 2022 | $2,280 | $196,121 | $66,110 | $130,011 |
| 2021 | $1,844 | $132,705 | $20,763 | $111,942 |
| 2020 | $1,745 | $217,866 | $37,750 | $180,116 |
| 2019 | $1,617 | $198,568 | $37,750 | $160,818 |
| 2018 | $1,409 | $164,015 | $30,000 | $134,015 |
| 2017 | $1,187 | $164,015 | $30,000 | $134,015 |
| 2016 | $949 | $77,982 | $15,125 | $62,857 |
| 2015 | $949 | $69,044 | $0 | $0 |
| 2014 | -- | $69,044 | $0 | $0 |
Source: Public Records
Map
Nearby Homes
- 591 W 400 N
- 148 N 580 W
- 428 W 600 N Unit 36
- 71 N Coleman St
- 225 230 N
- 634 N 640 W
- 322 W 600 N Unit 47
- 322 W 600 N
- 387 N 200 W
- 307 N 200 W
- 848 N 250 W Unit B
- 832 N 250 W Unit A
- 832 N 250 W Unit B
- 832 N 250 W Unit C
- 848 N 250 W Unit C
- 454 W 2520 N
- 694 Ry Ln
- 605 Kay Ln Unit 2013
- 343 W 630 North St Unit 18
- 374 W 630 North St Unit 10
Your Personal Tour Guide
Ask me questions while you tour the home.