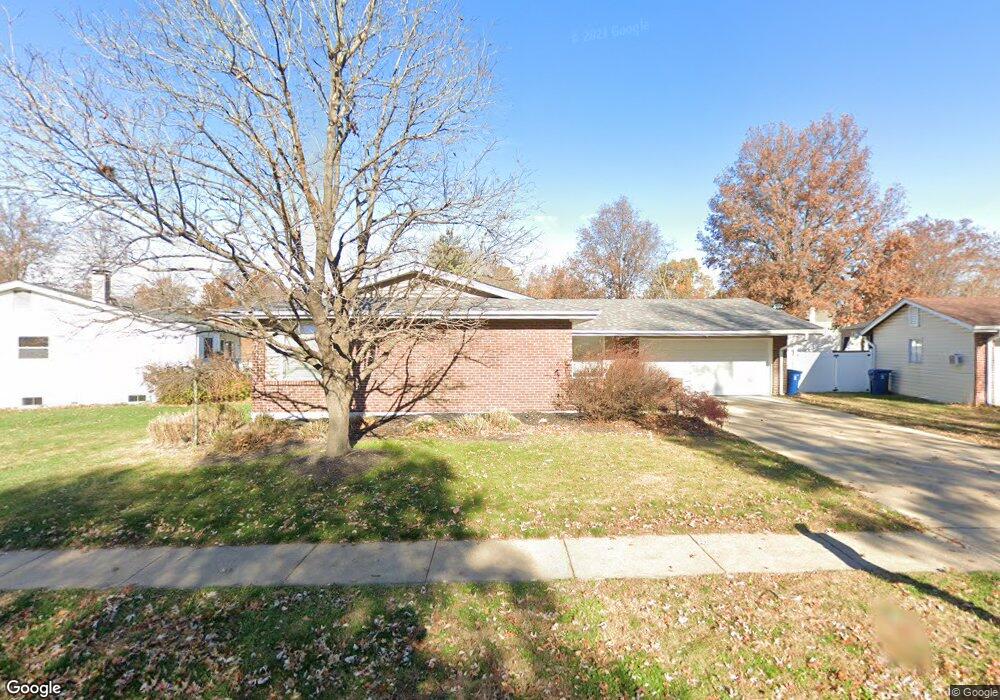
549 Ballwood Dr Ballwin, MO 63021
Estimated Value: $299,000 - $333,000
3
Beds
2
Baths
1,310
Sq Ft
$239/Sq Ft
Est. Value
About This Home
This home is located at 549 Ballwood Dr, Ballwin, MO 63021 and is currently estimated at $312,619, approximately $238 per square foot. 549 Ballwood Dr is a home located in St. Louis County with nearby schools including Woerther Elementary School, Selvidge Middle School, and Marquette Sr. High School.
Ownership History
Date
Name
Owned For
Owner Type
Purchase Details
Closed on
Feb 10, 2020
Sold by
Marty Gina N
Bought by
Marty Gina N and Katz Michael
Current Estimated Value
Home Financials for this Owner
Home Financials are based on the most recent Mortgage that was taken out on this home.
Original Mortgage
$208,373
Outstanding Balance
$172,128
Interest Rate
3.6%
Mortgage Type
New Conventional
Estimated Equity
$140,491
Purchase Details
Closed on
Aug 25, 2008
Sold by
Ancel Terance W and Ancel Courtney J
Bought by
Marty Gina N
Home Financials for this Owner
Home Financials are based on the most recent Mortgage that was taken out on this home.
Original Mortgage
$184,950
Interest Rate
6.29%
Mortgage Type
Purchase Money Mortgage
Purchase Details
Closed on
Sep 30, 2002
Sold by
Wenneker John F and Wenneker Debra J
Bought by
Ancel Terance W and Ancel Courtney J
Home Financials for this Owner
Home Financials are based on the most recent Mortgage that was taken out on this home.
Original Mortgage
$134,400
Interest Rate
6.2%
Purchase Details
Closed on
Mar 26, 2001
Sold by
Wenneker John F and Wenneker Debra J
Bought by
Wenneker Nicky D
Create a Home Valuation Report for This Property
The Home Valuation Report is an in-depth analysis detailing your home's value as well as a comparison with similar homes in the area
Home Values in the Area
Average Home Value in this Area
Purchase History
| Date | Buyer | Sale Price | Title Company |
|---|---|---|---|
| Marty Gina N | -- | Amrock Inc | |
| Marty Gina N | $205,500 | None Available | |
| Ancel Terance W | $168,000 | -- | |
| Wenneker Nicky D | -- | -- |
Source: Public Records
Mortgage History
| Date | Status | Borrower | Loan Amount |
|---|---|---|---|
| Open | Marty Gina N | $208,373 | |
| Closed | Marty Gina N | $184,950 | |
| Previous Owner | Ancel Terance W | $134,400 |
Source: Public Records
Tax History
| Year | Tax Paid | Tax Assessment Tax Assessment Total Assessment is a certain percentage of the fair market value that is determined by local assessors to be the total taxable value of land and additions on the property. | Land | Improvement |
|---|---|---|---|---|
| 2025 | $3,640 | $56,890 | $31,770 | $25,120 |
| 2024 | $3,640 | $51,950 | $24,720 | $27,230 |
| 2023 | $3,637 | $51,950 | $24,720 | $27,230 |
| 2022 | $3,281 | $43,480 | $21,190 | $22,290 |
| 2021 | $3,257 | $43,480 | $21,190 | $22,290 |
| 2020 | $3,078 | $39,160 | $17,650 | $21,510 |
| 2019 | $3,090 | $39,160 | $17,650 | $21,510 |
| 2018 | $3,023 | $36,120 | $13,240 | $22,880 |
| 2016 | $2,649 | $31,140 | $10,580 | $20,560 |
Source: Public Records
Map
Nearby Homes
- 370 Marywood Ct
- 318 Statewood Dr
- 677 Rustic Valley Dr
- 713 Village Wood Ct
- 332 Remington Way Dr
- 723 Westglen Village Dr
- 643 Nanceen Ct
- 279 Aspen Village Dr
- 725 Whispering Forest Dr
- 325 Fox Village Ct
- 760 Woodside Trails Dr Unit 203
- 947 Bellestri Dr
- 604 Pine Ridge Trails Ct Unit 202
- 215 Straightoak Ct
- 634 Parker Dr
- 873 Woodside Trails Dr Unit 853
- 847 Palm Bay Dr
- 275 Essen Ct Unit TBB
- 700 Juniper Glen Ct
- 313 Brightfield Dr
- 543 Ballwood Dr
- 571 Twigwood Dr
- 537 Ballwood Dr
- 536 Lemonwood Dr
- 542 Lemonwood Dr
- 530 Lemonwood Dr
- 575 Twigwood Dr
- 546 Ballwood Dr
- 548 Lemonwood Dr
- 554 Ballwood Dr
- 531 Ballwood Dr
- 540 Ballwood Dr
- 524 Lemonwood Dr
- 554 Lemonwood Dr
- 564 Twigwood Dr
- 579 Twigwood Dr
- 534 Ballwood Dr
- 560 Twigwood Dr
- 527 Ballwood Dr
- 576 Twigwood Dr
Your Personal Tour Guide
Ask me questions while you tour the home.