55 Blanding Rd Rehoboth, MA 02769
Estimated Value: $431,590 - $552,000
2
Beds
1
Bath
1,175
Sq Ft
$434/Sq Ft
Est. Value
About This Home
This home is located at 55 Blanding Rd, Rehoboth, MA 02769 and is currently estimated at $510,398, approximately $434 per square foot. 55 Blanding Rd is a home located in Bristol County with nearby schools including Dighton-Rehoboth Regional High School, St Margaret School, and Cedar Brook School.
Ownership History
Date
Name
Owned For
Owner Type
Purchase Details
Closed on
Dec 20, 1996
Sold by
Marcelino Steven A and Marcelino Lisa A
Bought by
Carlson Ronald K and Carlson Susan M
Current Estimated Value
Home Financials for this Owner
Home Financials are based on the most recent Mortgage that was taken out on this home.
Original Mortgage
$118,300
Outstanding Balance
$11,938
Interest Rate
7.62%
Mortgage Type
Purchase Money Mortgage
Estimated Equity
$498,460
Purchase Details
Closed on
Apr 29, 1994
Sold by
Reed Richard E
Bought by
Camara Lisa and Marcelino Steven A
Home Financials for this Owner
Home Financials are based on the most recent Mortgage that was taken out on this home.
Original Mortgage
$99,700
Interest Rate
7.7%
Mortgage Type
Purchase Money Mortgage
Purchase Details
Closed on
Jul 2, 1991
Sold by
Reed Robert R
Bought by
Reed Richard E
Home Financials for this Owner
Home Financials are based on the most recent Mortgage that was taken out on this home.
Original Mortgage
$65,000
Interest Rate
9.44%
Mortgage Type
Purchase Money Mortgage
Create a Home Valuation Report for This Property
The Home Valuation Report is an in-depth analysis detailing your home's value as well as a comparison with similar homes in the area
Home Values in the Area
Average Home Value in this Area
Purchase History
| Date | Buyer | Sale Price | Title Company |
|---|---|---|---|
| Carlson Ronald K | $116,000 | -- | |
| Camara Lisa | $105,000 | -- | |
| Reed Richard E | $95,000 | -- |
Source: Public Records
Mortgage History
| Date | Status | Borrower | Loan Amount |
|---|---|---|---|
| Open | Reed Richard E | $118,300 | |
| Previous Owner | Reed Richard E | $99,700 | |
| Previous Owner | Reed Richard E | $65,000 |
Source: Public Records
Tax History
| Year | Tax Paid | Tax Assessment Tax Assessment Total Assessment is a certain percentage of the fair market value that is determined by local assessors to be the total taxable value of land and additions on the property. | Land | Improvement |
|---|---|---|---|---|
| 2025 | $39 | $349,700 | $162,000 | $187,700 |
| 2024 | $3,931 | $346,000 | $162,000 | $184,000 |
| 2023 | $3,868 | $334,000 | $158,800 | $175,200 |
| 2022 | $3,442 | $271,700 | $151,600 | $120,100 |
| 2021 | $3,296 | $254,000 | $137,600 | $116,400 |
| 2020 | $3,184 | $242,700 | $137,600 | $105,100 |
| 2018 | $2,974 | $235,000 | $131,100 | $103,900 |
| 2017 | $2,952 | $235,000 | $131,100 | $103,900 |
| 2016 | $2,855 | $235,000 | $131,100 | $103,900 |
| 2015 | $2,755 | $223,800 | $124,800 | $99,000 |
| 2014 | $2,630 | $211,400 | $118,900 | $92,500 |
Source: Public Records
Map
Nearby Homes
- 252 Pine St
- 23 Colonial Way
- 67 Wheeler St
- 151 Wheeler St
- 794 County St
- 267 Chestnut St
- 0 Winter St
- 6 Running Stream Rd
- 55 Pamden Ln
- 277 Providence St
- 132 Jean Dr
- 111 Summer St
- 9 Tammy Jean Dr
- 702 Arcade Ave
- 155 Sagamore Rd
- 89 Walker St
- 209 Providence St Bldr Lot 1
- 54 Sagamore Rd
- 84 Pine St
- 3, 7, 11 Barney Ave Bldr Lot 7 8 9
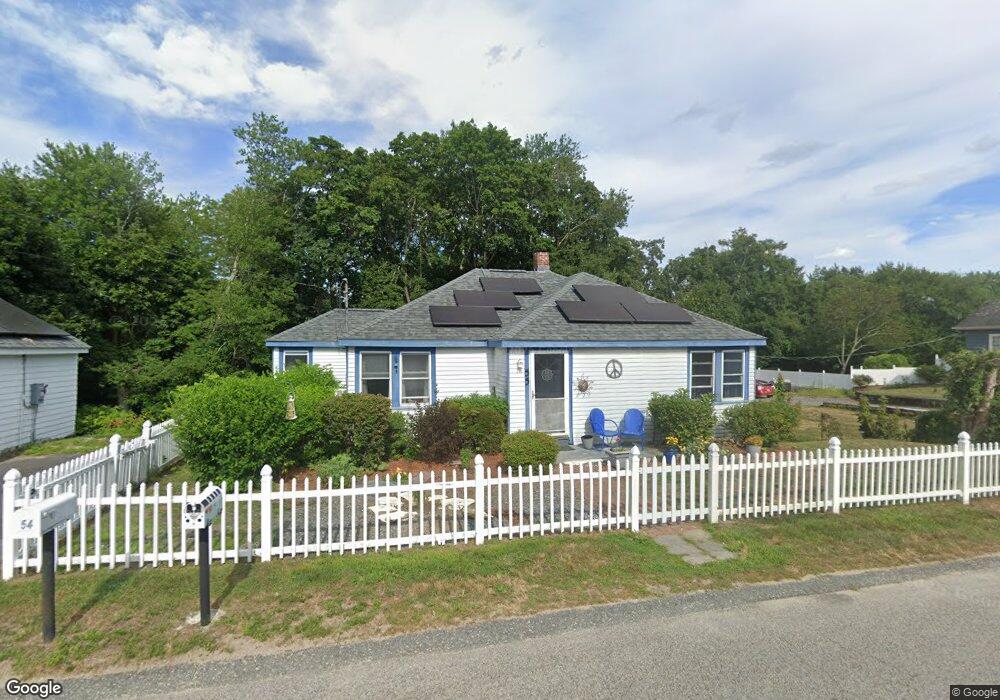
- 54 Blanding Rd
- 59 Blanding Rd
- 56 Blanding Rd
- 569 Winthrop St
- 569 Winthrop St Unit 2
- 569 Winthrop St Unit 3
- 569 Winthrop St Unit 1
- 58 Blanding Rd
- 52 Blanding Rd
- 44 Blanding Rd
- 570 Winthrop St
- 578 Winthrop St
- 576 Winthrop St
- 62 Blanding Rd
- 62 Blanding Rd Unit 2
- 63 Blanding Rd
- 37 Blanding Rd Unit 39
- 67 Blanding Rd
- 582 Winthrop St
- 68 Blanding Rd
Your Personal Tour Guide
Ask me questions while you tour the home.