55 Cedar Ln Osterville, MA 02655
Osterville NeighborhoodEstimated Value: $1,286,000 - $1,808,000
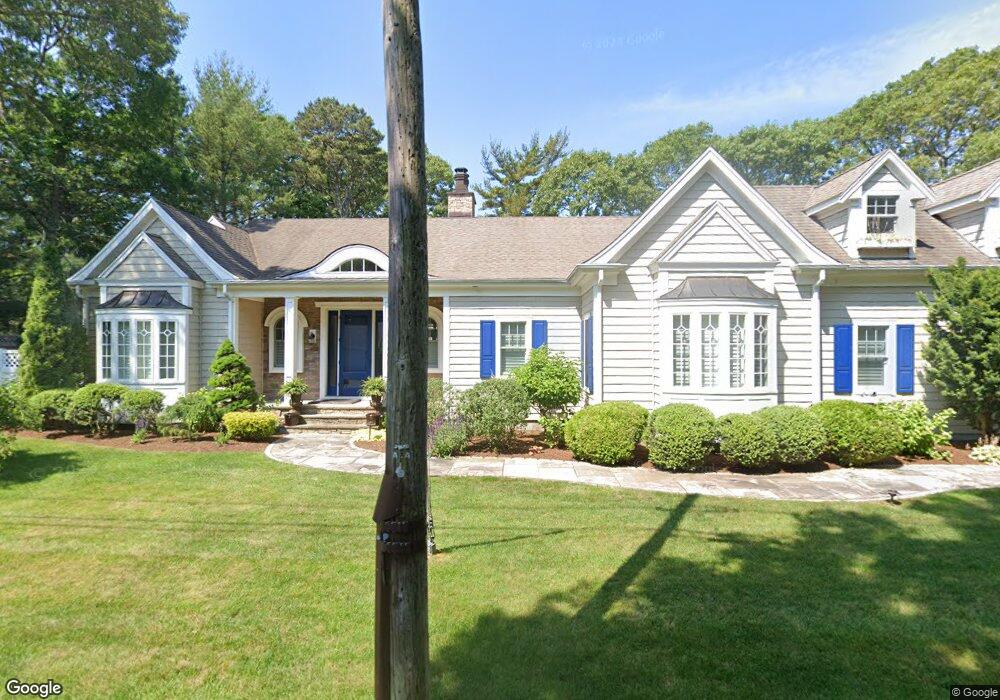
About This Home
This home is located at 55 Cedar Ln, Osterville, MA 02655 and is currently estimated at $1,496,168, approximately $1,870 per square foot. 55 Cedar Ln is a home located in Barnstable County with nearby schools including West Villages Elementary School, Barnstable United Elementary School, and Barnstable Intermediate School.
Ownership History
We collect this data history from publicly available records. To have your information removed, we recommend requesting removal directly through your county’s website.
Purchase Details
Purchase Details
Home Financials for this Owner
Home Financials are based on the most recent Mortgage that was taken out on this home.Home Values in the Area
Average Home Value in this Area
Purchase History
We collect this data history from publicly available records. To have your information removed, we recommend requesting removal directly through your county’s website.
| Date | Buyer | Sale Price | Title Company |
|---|---|---|---|
| -- | -- | ||
| $117,000 | -- |
Mortgage History
We collect this data history from publicly available records. To have your information removed, we recommend requesting removal directly through your county’s website.
| Date | Status | Borrower | Loan Amount |
|---|---|---|---|
| Previous Owner | $92,000 |
Tax History
We collect this data history from publicly available records. To have your information removed, we recommend requesting removal directly through your county’s website.
| Year | Tax Paid | Tax Assessment Tax Assessment Total Assessment is a certain percentage of the fair market value that is determined by local assessors to be the total taxable value of land and additions on the property. | Land | Improvement |
|---|---|---|---|---|
| 2025 | $10,801 | $1,335,100 | $334,200 | $1,000,900 |
| 2024 | $10,180 | $1,303,400 | $334,200 | $969,200 |
| 2023 | $8,976 | $1,076,300 | $310,700 | $765,600 |
| 2022 | $8,985 | $932,100 | $214,800 | $717,300 |
| 2021 | $9,076 | $865,200 | $235,300 | $629,900 |
| 2020 | $9,167 | $836,400 | $235,300 | $601,100 |
| 2019 | $8,518 | $755,100 | $245,500 | $509,600 |
| 2018 | $8,812 | $785,400 | $247,700 | $537,700 |
| 2017 | $8,319 | $773,100 | $247,700 | $525,400 |
| 2016 | $8,448 | $775,000 | $249,600 | $525,400 |
| 2015 | $7,978 | $735,300 | $242,400 | $492,900 |
Map
- 39 Tower Hill Rd Unit 15B
- 955 Main St
- 60 Linden Ln
- 84 Hinckley Cir
- 40 Waterfield Rd
- 33 Sunset Ln
- 727 Main St Unit B1
- 727 Main St Unit B1
- 727 Main St Unit 3
- 727 Main St Unit F3
- 105 Parker Rd Unit B
- 105 Parker Rd Unit B
- 140 Seapuit Rd
- 107 Parsley Ln
- 177 Bayview Cir
- 16 Second Unit 4
- 12 Cockachoiset Ln
- 146 Scudder Rd
- 12 Cockachoiset
- 30 Cockachoiset Ln
Ask me questions while you tour the home.