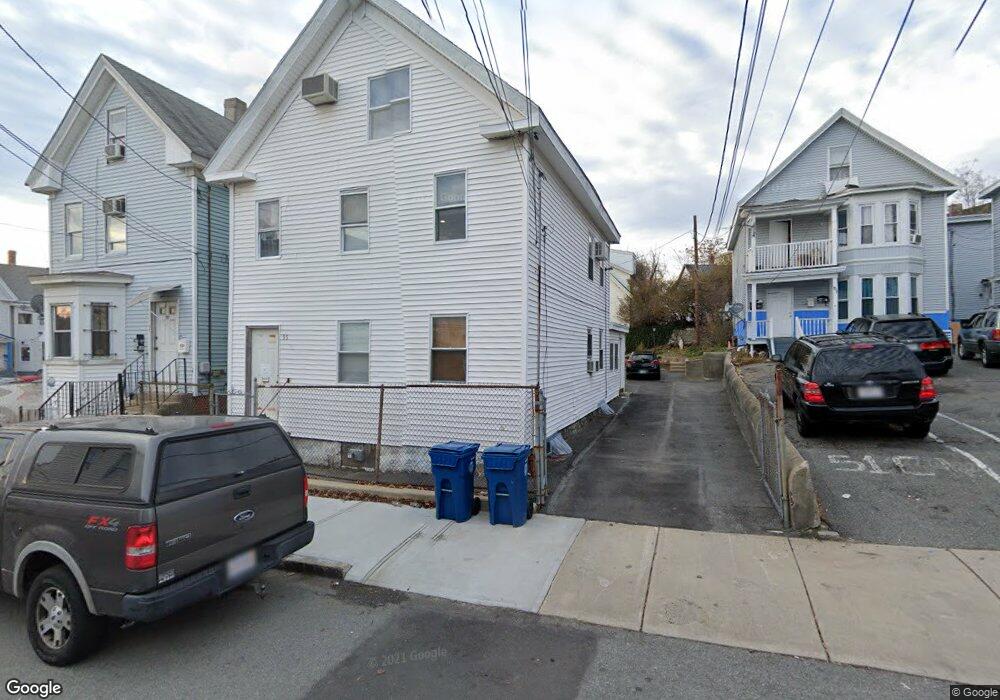
55 Cedar St Lawrence, MA 01841
Arlington NeighborhoodEstimated Value: $643,000 - $762,000
About This Home
This home is located at 55 Cedar St, Lawrence, MA 01841 and is currently estimated at $687,804, approximately $296 per square foot. 55 Cedar St is a home located in Essex County with nearby schools including School For Exceptional Studies, John K Tarbox Elementary School, and Notre Dame Cristo Rey High School.
Ownership History
We collect this data history from publicly available records. To have your information removed, we recommend requesting removal directly through your county’s website.
Purchase Details
Home Values in the Area
Average Home Value in this Area
Purchase History
We collect this data history from publicly available records. To have your information removed, we recommend requesting removal directly through your county’s website.
| Date | Buyer | Sale Price | Title Company |
|---|---|---|---|
| $77,000 | -- |
Mortgage History
We collect this data history from publicly available records. To have your information removed, we recommend requesting removal directly through your county’s website.
| Date | Status | Borrower | Loan Amount |
|---|---|---|---|
| Open | $102,322 | ||
| Closed | $110,000 | ||
| Closed | $105,800 |
Tax History
We collect this data history from publicly available records. To have your information removed, we recommend requesting removal directly through your county’s website.
| Year | Tax Paid | Tax Assessment Tax Assessment Total Assessment is a certain percentage of the fair market value that is determined by local assessors to be the total taxable value of land and additions on the property. | Land | Improvement |
|---|---|---|---|---|
| 2025 | $4,434 | $503,900 | $97,500 | $406,400 |
| 2024 | $4,024 | $435,000 | $102,400 | $332,600 |
| 2023 | $4,276 | $420,900 | $98,900 | $322,000 |
| 2022 | $3,853 | $336,800 | $93,200 | $243,600 |
| 2021 | $3,780 | $308,100 | $93,200 | $214,900 |
| 2020 | $3,636 | $292,500 | $77,700 | $214,800 |
| 2019 | $3,361 | $245,700 | $57,800 | $187,900 |
| 2018 | $3,105 | $216,800 | $52,300 | $164,500 |
| 2017 | $2,919 | $190,300 | $49,600 | $140,700 |
| 2016 | $2,812 | $181,300 | $38,700 | $142,600 |
| 2015 | $2,700 | $178,600 | $38,700 | $139,900 |
Map
- 106-110 Tremont St
- 40-42 Holly St
- 202 Broadway Unit 2-3
- 202 Broadway Unit 3-2
- 41 Railroad St
- 95 Myrtle St
- 10 Kempton Ct
- 87-89 Margin St
- 15 Crescent St Unit D
- 46 Amesbury St Unit 2B
- 15 Bunkerhill St
- 71-75 Common St
- 4 Chelmsford St
- 11 Lawrence St Unit 510
- 66-68 Water St
- 22 Camden St Unit A
- 18 Hancock St
- 15-17 Allyn Terrace
- 229 Jackson St
- 155-157 Tenney St
- 40 Cedar St Unit B
- 38 Cedar St Unit A
- 38 Cedar St Unit A
- 28 Cedar St Unit 30
- 33-35 Cedar St Unit 3
- 43 Cedar St Unit 47
- 45 Cedar St Unit 2
- 45 Cedar St
- 33 Cedar St Unit 35
- 49/51 Cedar St
- 50 Cedar St
- 160 Franklin St
- 162 Franklin St
- 62 Cross St
- 29 Cedar St
- 37 Cedar St Unit 4
- 37 Cedar St Unit 1
- 49-51 Cedar St
- 150 Franklin St Unit 152
- 309 Broadway Unit 317
Ask me questions while you tour the home.