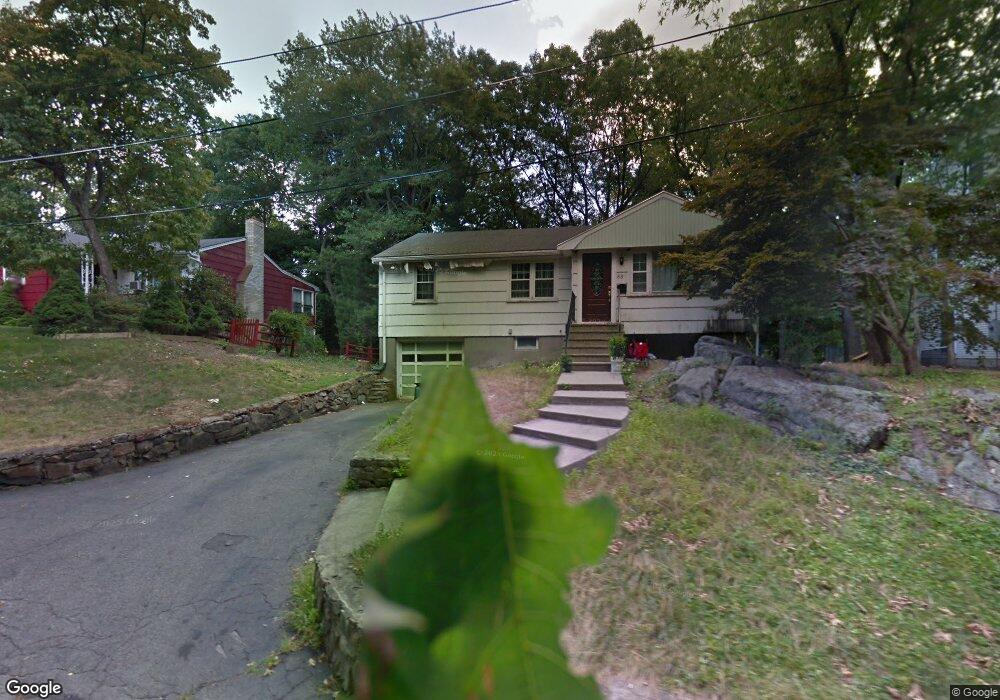
55 Circuit Rd Quincy, MA 02169
South Quincy NeighborhoodEstimated Value: $709,000 - $979,000
4
Beds
3
Baths
2,144
Sq Ft
$411/Sq Ft
Est. Value
About This Home
This home is located at 55 Circuit Rd, Quincy, MA 02169 and is currently estimated at $881,254, approximately $411 per square foot. 55 Circuit Rd is a home located in Norfolk County with nearby schools including Lincoln-Hancock Community School, South West Middle School, and Quincy High School.
Ownership History
Date
Name
Owned For
Owner Type
Purchase Details
Closed on
Jun 28, 2013
Sold by
Floye L Macdonald and Floye Macdonald
Bought by
Nguyen Tiffany
Current Estimated Value
Home Financials for this Owner
Home Financials are based on the most recent Mortgage that was taken out on this home.
Original Mortgage
$200,000
Outstanding Balance
$139,478
Interest Rate
3.51%
Mortgage Type
New Conventional
Estimated Equity
$741,776
Create a Home Valuation Report for This Property
The Home Valuation Report is an in-depth analysis detailing your home's value as well as a comparison with similar homes in the area
Home Values in the Area
Average Home Value in this Area
Purchase History
| Date | Buyer | Sale Price | Title Company |
|---|---|---|---|
| Nguyen Tiffany | $260,000 | -- | |
| Nguyen Tiffany | $260,000 | -- |
Source: Public Records
Mortgage History
| Date | Status | Borrower | Loan Amount |
|---|---|---|---|
| Open | Nguyen Tiffany | $200,000 | |
| Closed | Nguyen Tiffany | $200,000 |
Source: Public Records
Tax History
| Year | Tax Paid | Tax Assessment Tax Assessment Total Assessment is a certain percentage of the fair market value that is determined by local assessors to be the total taxable value of land and additions on the property. | Land | Improvement |
|---|---|---|---|---|
| 2025 | $10,256 | $889,500 | $298,800 | $590,700 |
| 2024 | $9,731 | $863,400 | $284,600 | $578,800 |
| 2023 | $8,869 | $796,900 | $258,700 | $538,200 |
| 2022 | $9,039 | $754,500 | $235,200 | $519,300 |
| 2021 | $8,885 | $731,900 | $235,200 | $496,700 |
| 2020 | $8,587 | $690,800 | $221,800 | $469,000 |
| 2019 | $6,091 | $485,300 | $205,400 | $279,900 |
| 2018 | $4,314 | $323,400 | $186,800 | $136,600 |
| 2017 | $4,211 | $297,200 | $177,900 | $119,300 |
| 2016 | $3,927 | $273,500 | $161,700 | $111,800 |
| 2015 | $3,719 | $254,700 | $152,500 | $102,200 |
| 2014 | $3,777 | $254,200 | $152,500 | $101,700 |
Source: Public Records
Map
Nearby Homes
- 21 Spaulding St
- 200 Falls Blvd Unit E101
- 200 Falls Blvd Unit B208
- 200 Falls Blvd Unit B305
- 150 Quincy Ave Unit 3A
- 15 Bower Rd Unit F9
- 25 W Howard St Unit G3
- 150 Madison Ave
- 35 Desmoines Rd Unit 209
- 97 Sumner St Unit 1
- 86 E Howard St Unit 107
- 99 Sumner St Unit 2
- 99 Sumner St Unit 1
- 37 Skyline Dr Unit 11
- 30 Skyline Dr Unit 6
- 101 Sumner St Unit 2
- 101 Sumner St Unit 1
- 98 Sumner St
- 155 Kendrick Ave Unit 502
- 202 Kendrick Ave
Your Personal Tour Guide
Ask me questions while you tour the home.