55 Hancock St Abington, MA 02351
Estimated Value: $706,276 - $785,000
About This Home
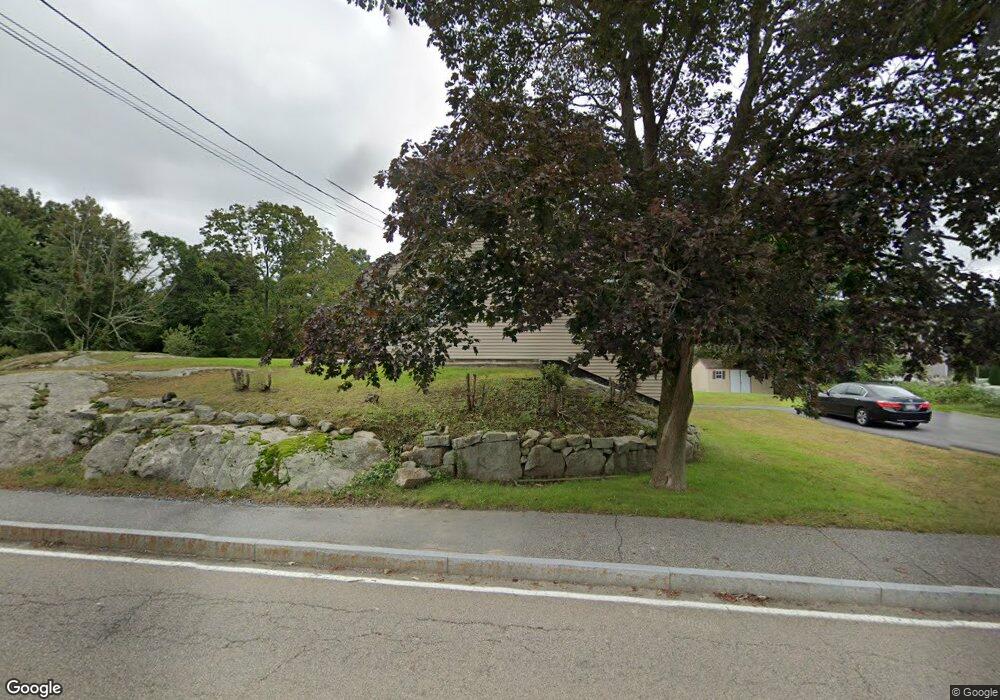
This home is located at 55 Hancock St, Abington, MA 02351 and is currently estimated at $753,069, approximately $351 per square foot. 55 Hancock St is a home located in Plymouth County with nearby schools including Woodsdale School, Beaver Brook Elementary School, and Abington Middle School.
Ownership History
We collect this data history from publicly available records. To have your information removed, we recommend requesting removal directly through your county’s website.
Purchase Details
Purchase Details
Purchase Details
Purchase Details
Home Values in the Area
Average Home Value in this Area
Purchase History
We collect this data history from publicly available records. To have your information removed, we recommend requesting removal directly through your county’s website.
| Date | Buyer | Sale Price | Title Company |
|---|---|---|---|
| $182,000 | -- | ||
| $57,595 | -- | ||
| $136,372 | -- | ||
| $118,000 | -- |
Mortgage History
We collect this data history from publicly available records. To have your information removed, we recommend requesting removal directly through your county’s website.
| Date | Status | Borrower | Loan Amount |
|---|---|---|---|
| Open | $282,851 | ||
| Closed | $249,299 | ||
| Closed | $15,000 |
Tax History
We collect this data history from publicly available records. To have your information removed, we recommend requesting removal directly through your county’s website.
| Year | Tax Paid | Tax Assessment Tax Assessment Total Assessment is a certain percentage of the fair market value that is determined by local assessors to be the total taxable value of land and additions on the property. | Land | Improvement |
|---|---|---|---|---|
| 2025 | $8,268 | $633,100 | $243,200 | $389,900 |
| 2024 | $7,906 | $590,900 | $221,500 | $369,400 |
| 2023 | $7,385 | $519,700 | $193,100 | $326,600 |
| 2022 | $7,164 | $470,700 | $169,500 | $301,200 |
| 2021 | $12,199 | $409,600 | $154,100 | $255,500 |
| 2020 | $5,703 | $400,500 | $149,500 | $251,000 |
| 2019 | $5,027 | $386,900 | $142,600 | $244,300 |
| 2018 | $6,364 | $357,100 | $142,600 | $214,500 |
| 2017 | $3,116 | $349,000 | $142,600 | $206,400 |
| 2016 | $5,714 | $318,700 | $136,000 | $182,700 |
| 2015 | $5,194 | $305,500 | $136,000 | $169,500 |
Map
- 138 Malinda Dr
- 22 Nardone Cir
- 214 Presidential Dr
- 373 Hancock St
- 26 Crabtree Ln
- 45 Groveland St
- 416 Thayer St Unit 416
- 70 Groveland St
- 13 Mahoney Cir
- 125 High St
- 23 Belmont St
- 34 Brockton Ave
- 206 High St
- 113 Colonel Hunt Dr
- 0 Bedford St
- 9 Lydon Ln Unit C2
- 55 Clapp St
- 67 Roslyn Rd
- 73 Laurie Ave
- 20 Cleverly St Unit A4
Ask me questions while you tour the home.