55 High St Carver, MA 02330
Estimated Value: $747,354 - $918,000
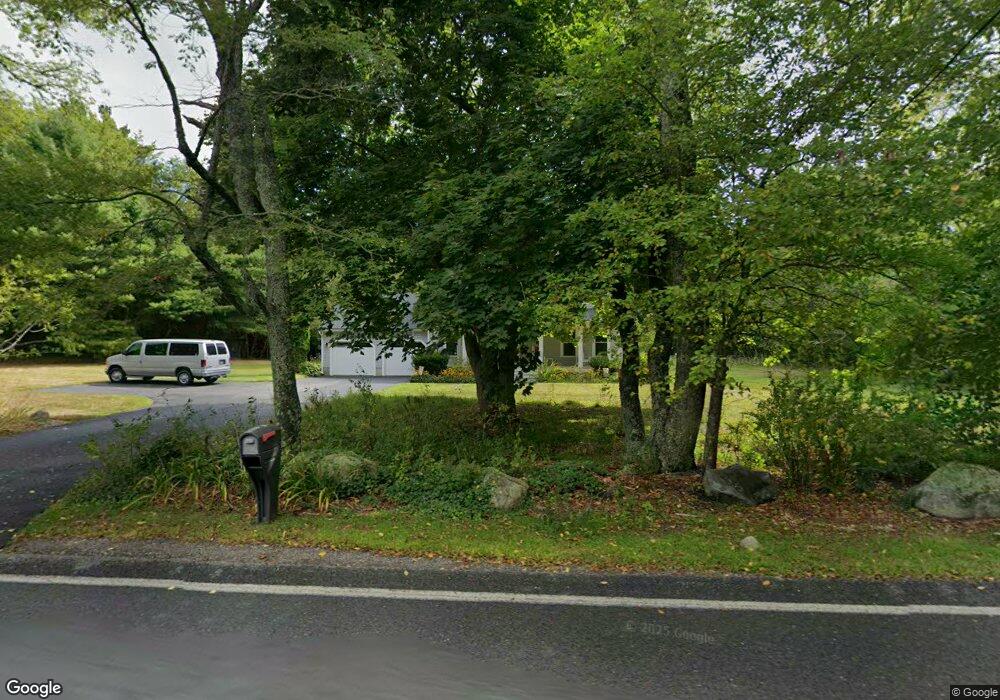
About This Home
This home is located at 55 High St, Carver, MA 02330 and is currently estimated at $826,339, approximately $409 per square foot. 55 High St is a home located in Plymouth County with nearby schools including Carver Elementary School and Carver Middle/High School.
Ownership History
We collect this data history from publicly available records. To have your information removed, we recommend requesting removal directly through your county’s website.
Purchase Details
Purchase Details
Home Financials for this Owner
Home Financials are based on the most recent Mortgage that was taken out on this home.Home Values in the Area
Average Home Value in this Area
Purchase History
We collect this data history from publicly available records. To have your information removed, we recommend requesting removal directly through your county’s website.
| Date | Buyer | Sale Price | Title Company |
|---|---|---|---|
| -- | -- | ||
| -- | -- | ||
| $352,000 | -- | ||
| $352,000 | -- |
Mortgage History
We collect this data history from publicly available records. To have your information removed, we recommend requesting removal directly through your county’s website.
| Date | Status | Borrower | Loan Amount |
|---|---|---|---|
| Previous Owner | $213,000 | ||
| Previous Owner | $322,700 | ||
| Previous Owner | $20,000 | ||
| Previous Owner | $334,400 |
Tax History
We collect this data history from publicly available records. To have your information removed, we recommend requesting removal directly through your county’s website.
| Year | Tax Paid | Tax Assessment Tax Assessment Total Assessment is a certain percentage of the fair market value that is determined by local assessors to be the total taxable value of land and additions on the property. | Land | Improvement |
|---|---|---|---|---|
| 2025 | $8,756 | $631,300 | $170,100 | $461,200 |
| 2024 | $8,241 | $581,600 | $166,700 | $414,900 |
| 2023 | $7,930 | $543,500 | $166,700 | $376,800 |
| 2022 | $7,432 | $465,100 | $142,600 | $322,500 |
| 2021 | $7,360 | $434,500 | $127,400 | $307,100 |
| 2020 | $7,014 | $408,000 | $119,000 | $289,000 |
| 2019 | $6,823 | $400,200 | $115,500 | $284,700 |
| 2018 | $6,560 | $372,100 | $115,500 | $256,600 |
| 2017 | $6,331 | $357,900 | $111,200 | $246,700 |
| 2016 | $5,828 | $342,200 | $105,900 | $236,300 |
| 2015 | $5,567 | $327,300 | $105,900 | $221,400 |
| 2014 | $5,411 | $318,100 | $133,800 | $184,300 |
Map
- 86 High St Unit 1
- 147 Plymouth St
- 11 Brockton Ave
- 18 Annasnappitt Dr
- 19 Santana Way Unit 19
- 39 Leonard St
- 0 Fuller St Unit 73525385
- 3 Kestrel Way
- 2 Commons Dr
- 7 Stanley Ln
- 16 Churchill Rd
- 31 Parsonage Rd
- 35 Silva St
- 3 Lydon Ln Unit A1
- 8 Cornish St
- 77 Center St
- 5 Brook St
- 0 Palmer Rd Unit 73525924
- 13 Craig St
- 13 Pond View Way
Ask me questions while you tour the home.