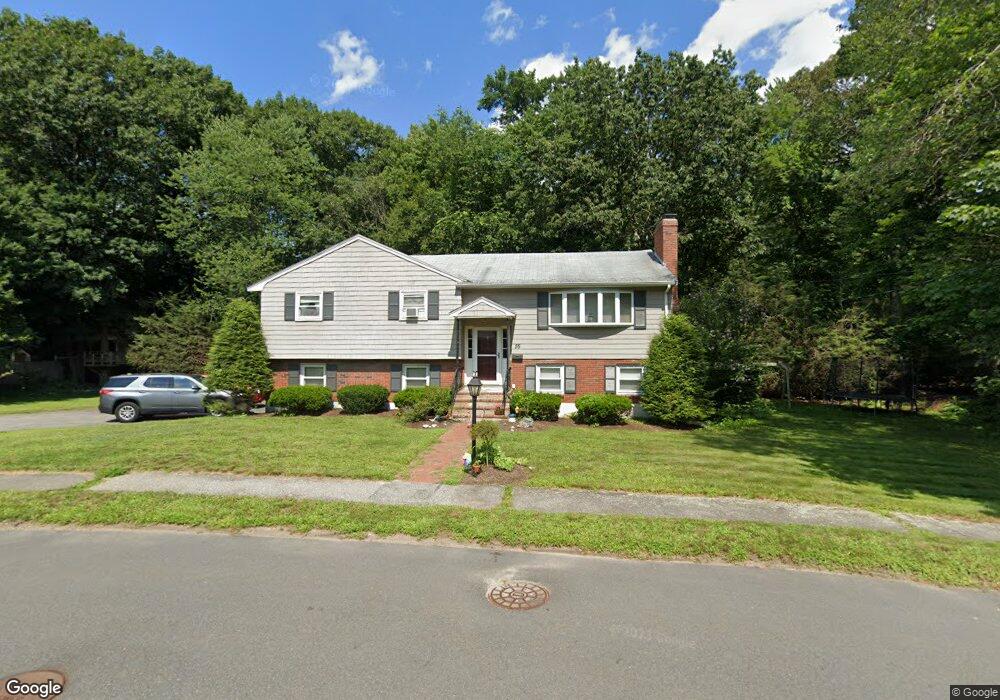
55 Martin Rd Reading, MA 01867
Estimated Value: $874,000 - $950,000
3
Beds
2
Baths
1,646
Sq Ft
$552/Sq Ft
Est. Value
About This Home
This home is located at 55 Martin Rd, Reading, MA 01867 and is currently estimated at $908,871, approximately $552 per square foot. 55 Martin Rd is a home located in Middlesex County with nearby schools including Birch Meadow Elementary School, Arthur W. Coolidge Middle School, and Reading Memorial High School.
Ownership History
Date
Name
Owned For
Owner Type
Purchase Details
Closed on
Aug 1, 2012
Sold by
Martins Valerie
Bought by
Jones Matthew and Jones Andrea A
Current Estimated Value
Home Financials for this Owner
Home Financials are based on the most recent Mortgage that was taken out on this home.
Original Mortgage
$399,000
Outstanding Balance
$269,853
Interest Rate
3.7%
Mortgage Type
New Conventional
Estimated Equity
$639,019
Purchase Details
Closed on
May 9, 2003
Sold by
Martins Valerie and Martins Paul A
Bought by
Martins Valerie
Create a Home Valuation Report for This Property
The Home Valuation Report is an in-depth analysis detailing your home's value as well as a comparison with similar homes in the area
Home Values in the Area
Average Home Value in this Area
Purchase History
We collect this data history from publicly available records. To have your information removed, we recommend requesting removal directly through your county’s website.
| Date | Buyer | Sale Price | Title Company |
|---|---|---|---|
| Jones Matthew | $420,000 | -- | |
| Jones Matthew | $420,000 | -- | |
| Martins Valerie | -- | -- | |
| Martins Valerie | -- | -- |
Source: Public Records
Mortgage History
We collect this data history from publicly available records. To have your information removed, we recommend requesting removal directly through your county’s website.
| Date | Status | Borrower | Loan Amount |
|---|---|---|---|
| Open | Jones Matthew | $399,000 | |
| Closed | Martins Valerie | $399,000 | |
| Previous Owner | Martins Valerie | $105,500 |
Source: Public Records
Tax History
| Year | Tax Paid | Tax Assessment Tax Assessment Total Assessment is a certain percentage of the fair market value that is determined by local assessors to be the total taxable value of land and additions on the property. | Land | Improvement |
|---|---|---|---|---|
| 2025 | $9,267 | $813,600 | $519,800 | $293,800 |
| 2024 | $9,159 | $781,500 | $499,300 | $282,200 |
| 2023 | $8,872 | $704,700 | $450,200 | $254,500 |
| 2022 | $8,539 | $640,600 | $409,300 | $231,300 |
| 2021 | $8,615 | $623,800 | $392,200 | $231,600 |
| 2020 | $8,281 | $593,600 | $373,200 | $220,400 |
| 2019 | $8,046 | $565,400 | $355,500 | $209,900 |
| 2018 | $7,395 | $533,200 | $335,300 | $197,900 |
| 2017 | $7,057 | $503,000 | $316,300 | $186,700 |
| 2016 | $7,202 | $496,700 | $316,700 | $180,000 |
| 2015 | $6,747 | $459,000 | $292,700 | $166,300 |
| 2014 | $6,537 | $443,500 | $282,800 | $160,700 |
Source: Public Records
Map
Nearby Homes
Your Personal Tour Guide
Ask me questions while you tour the home.