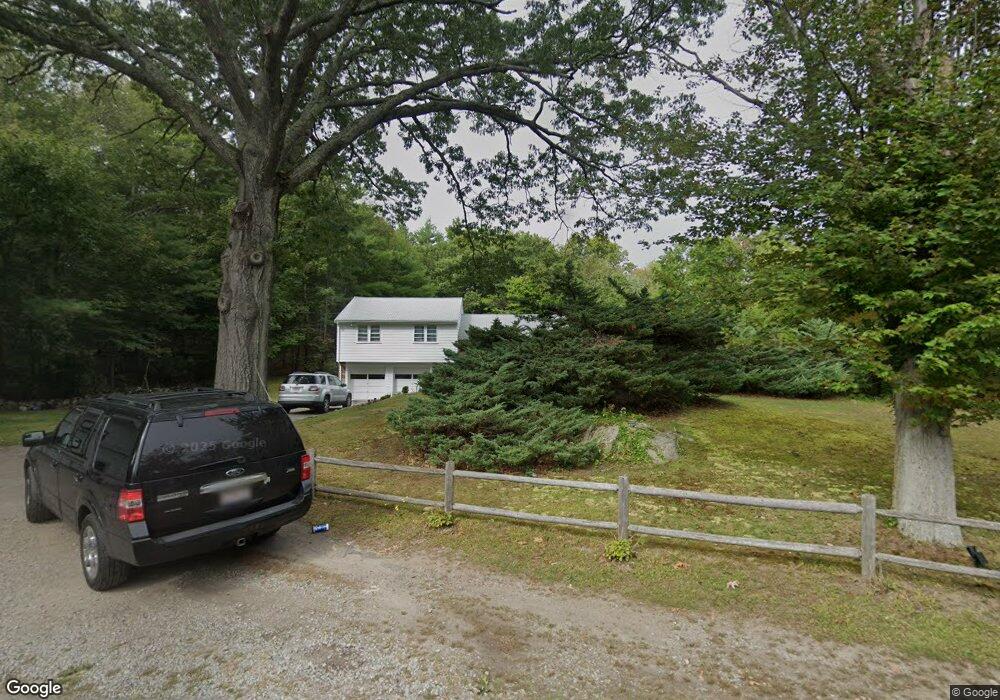
55 Oak St Hingham, MA 02043
Estimated Value: $869,000 - $990,000
3
Beds
2
Baths
1,272
Sq Ft
$731/Sq Ft
Est. Value
About This Home
This home is located at 55 Oak St, Hingham, MA 02043 and is currently estimated at $929,664, approximately $730 per square foot. 55 Oak St is a home located in Plymouth County with nearby schools including East Elementary School, Hingham Middle School, and Hingham High School.
Ownership History
Date
Name
Owned For
Owner Type
Purchase Details
Closed on
Sep 21, 2010
Sold by
Emanuello Lynica and Emanuello Albert A
Bought by
Emanuello Lynica
Current Estimated Value
Purchase Details
Closed on
Nov 21, 2006
Sold by
Riciputi Frances and Riciputi Secondo
Bought by
Emanuello Lynica and Emanuello Albert A
Purchase Details
Closed on
May 31, 2006
Sold by
Riciputi Frances
Bought by
Iaria Ft
Create a Home Valuation Report for This Property
The Home Valuation Report is an in-depth analysis detailing your home's value as well as a comparison with similar homes in the area
Purchase History
| Date | Buyer | Sale Price | Title Company |
|---|---|---|---|
| Emanuello Lynica | -- | -- | |
| Emanuello Lynica | $485,000 | -- | |
| Iaria Ft | $50,000 | -- |
Source: Public Records
Tax History
| Year | Tax Paid | Tax Assessment Tax Assessment Total Assessment is a certain percentage of the fair market value that is determined by local assessors to be the total taxable value of land and additions on the property. | Land | Improvement |
|---|---|---|---|---|
| 2025 | $7,189 | $672,500 | $327,600 | $344,900 |
| 2024 | $6,510 | $600,000 | $327,600 | $272,400 |
| 2023 | $5,704 | $570,400 | $327,600 | $242,800 |
| 2022 | $5,746 | $497,100 | $292,900 | $204,200 |
| 2021 | $6,590 | $488,900 | $292,900 | $196,000 |
| 2020 | $5,637 | $488,900 | $292,900 | $196,000 |
| 2019 | $5,657 | $479,000 | $292,900 | $186,100 |
| 2018 | $4,998 | $467,500 | $292,900 | $174,600 |
| 2017 | $5,606 | $397,200 | $246,500 | $150,700 |
| 2016 | $4,998 | $400,200 | $234,800 | $165,400 |
| 2015 | $4,874 | $389,000 | $223,600 | $165,400 |
Source: Public Records
Map
Nearby Homes
- 193 East St
- 792 Jerusalem Rd
- 10 Boulder Glen Rd
- 8 Evergreen Ln
- 3 Evergreen Ln
- 23 Wyola Rd
- 94 Nantasket Ave
- 37 Richards Rd
- 99 Nantasket Ave
- 26 School St Unit 206
- 30 Diab Ln Unit 8
- 00 George Washington Blvd
- 130 Forest Ave
- 112 Martins Ln
- 22 Berkley Rd Unit 2
- 15 Park Ave Unit 107
- 120 Nantasket Ave Unit 207
- 120 Nantasket Ave Unit 204
- 120 Nantasket Ave Unit 304
- 120 Nantasket Ave Unit PH5
Your Personal Tour Guide
Ask me questions while you tour the home.