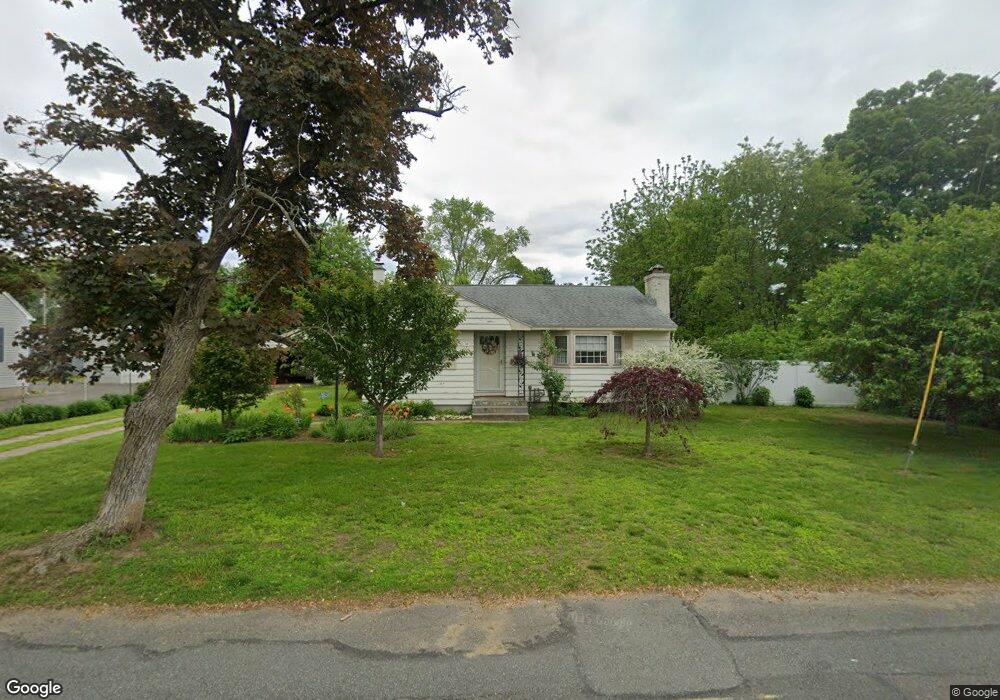
55 Pinehurst St Westfield, MA 01085
Estimated Value: $280,506 - $326,000
2
Beds
1
Bath
956
Sq Ft
$322/Sq Ft
Est. Value
About This Home
This home is located at 55 Pinehurst St, Westfield, MA 01085 and is currently estimated at $307,627, approximately $321 per square foot. 55 Pinehurst St is a home located in Hampden County with nearby schools including Westfield High School and Saint Mary High School.
Ownership History
Date
Name
Owned For
Owner Type
Purchase Details
Closed on
Sep 7, 2006
Sold by
Holmes Karen D
Bought by
Holmes Ft and Holmes Karen D
Current Estimated Value
Purchase Details
Closed on
Oct 22, 2003
Sold by
Netzer Ronald J and Netzer Victoria M
Bought by
Holmes Karen D
Home Financials for this Owner
Home Financials are based on the most recent Mortgage that was taken out on this home.
Original Mortgage
$115,000
Interest Rate
6.15%
Mortgage Type
Purchase Money Mortgage
Purchase Details
Closed on
Oct 2, 1995
Sold by
Bogdan Chester P and Bogdan Jane K
Bought by
Netzer Ronald J and Netzer Victoria M
Create a Home Valuation Report for This Property
The Home Valuation Report is an in-depth analysis detailing your home's value as well as a comparison with similar homes in the area
Home Values in the Area
Average Home Value in this Area
Purchase History
We collect this data history from publicly available records. To have your information removed, we recommend requesting removal directly through your county’s website.
| Date | Buyer | Sale Price | Title Company |
|---|---|---|---|
| Holmes Ft | -- | -- | |
| Holmes Karen D | $154,900 | -- | |
| Netzer Ronald J | $105,000 | -- |
Source: Public Records
Mortgage History
We collect this data history from publicly available records. To have your information removed, we recommend requesting removal directly through your county’s website.
| Date | Status | Borrower | Loan Amount |
|---|---|---|---|
| Previous Owner | Holmes Karen D | $115,000 |
Source: Public Records
Tax History
| Year | Tax Paid | Tax Assessment Tax Assessment Total Assessment is a certain percentage of the fair market value that is determined by local assessors to be the total taxable value of land and additions on the property. | Land | Improvement |
|---|---|---|---|---|
| 2025 | $3,742 | $246,500 | $97,400 | $149,100 |
| 2024 | $3,796 | $237,700 | $88,600 | $149,100 |
| 2023 | $3,530 | $215,200 | $84,400 | $130,800 |
| 2022 | $3,530 | $190,900 | $75,300 | $115,600 |
| 2021 | $3,419 | $181,100 | $71,000 | $110,100 |
| 2020 | $3,326 | $172,800 | $71,000 | $101,800 |
| 2019 | $3,251 | $165,300 | $67,600 | $97,700 |
| 2018 | $3,200 | $165,300 | $67,600 | $97,700 |
| 2017 | $3,150 | $162,200 | $68,600 | $93,600 |
| 2016 | $3,153 | $162,200 | $68,600 | $93,600 |
| 2015 | $3,007 | $162,200 | $68,600 | $93,600 |
| 2014 | $2,247 | $162,200 | $68,600 | $93,600 |
Source: Public Records
Map
Nearby Homes
- 0 Lockhouse Rd Unit 73496193
- 19 Arch Rd
- 9 Montgomery St
- 88 Woodmont St
- 11 Notre Dame St Unit A
- 7 Sibley Ave
- 19 Kellogg St
- 97 Mechanic St
- 205 Elm St
- 100 Meadow St
- 11 W School St
- 13 Hampden St
- 32 Allen Ave
- 13 Green Ave
- 10 W School St
- 25 King St
- 38 Klondike Ave
- 36 Klondike Ave Unit Ave
- 180 Russell Rd
- 145 Main St
Your Personal Tour Guide
Ask me questions while you tour the home.