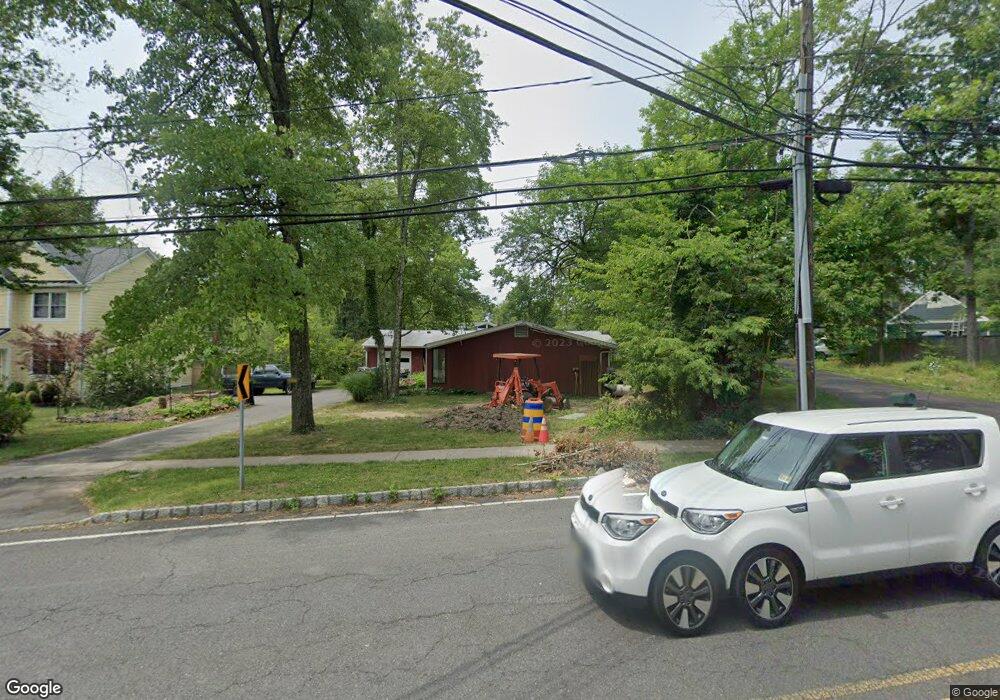
552 Ewing St Princeton, NJ 08540
Estimated Value: $760,213 - $1,021,000
Studio
--
Bath
1,947
Sq Ft
$465/Sq Ft
Est. Value
About This Home
This home is located at 552 Ewing St, Princeton, NJ 08540 and is currently estimated at $905,303, approximately $464 per square foot. 552 Ewing St is a home located in Mercer County with nearby schools including Community Park Elementary School, Princeton Middle School, and Princeton High School.
Ownership History
Date
Name
Owned For
Owner Type
Purchase Details
Closed on
Mar 11, 2021
Sold by
Tillett Susan D
Bought by
Tillett Jeffrey A
Current Estimated Value
Home Financials for this Owner
Home Financials are based on the most recent Mortgage that was taken out on this home.
Original Mortgage
$350,000
Outstanding Balance
$258,391
Interest Rate
2.5%
Mortgage Type
Seller Take Back
Estimated Equity
$646,912
Purchase Details
Closed on
Aug 28, 2020
Sold by
Tillett Jeffrey A and Estate Of Virginia E Wilson
Bought by
Tillett Susan D
Create a Home Valuation Report for This Property
The Home Valuation Report is an in-depth analysis detailing your home's value as well as a comparison with similar homes in the area
Home Values in the Area
Average Home Value in this Area
Purchase History
| Date | Buyer | Sale Price | Title Company |
|---|---|---|---|
| Tillett Jeffrey A | $500,000 | None Available | |
| Tillett Susan D | -- | None Available |
Source: Public Records
Mortgage History
| Date | Status | Borrower | Loan Amount |
|---|---|---|---|
| Open | Tillett Jeffrey A | $350,000 |
Source: Public Records
Tax History
| Year | Tax Paid | Tax Assessment Tax Assessment Total Assessment is a certain percentage of the fair market value that is determined by local assessors to be the total taxable value of land and additions on the property. | Land | Improvement |
|---|---|---|---|---|
| 2025 | $12,383 | $465,000 | $310,000 | $155,000 |
| 2024 | $11,690 | $465,000 | $310,000 | $155,000 |
| 2023 | $11,690 | $465,000 | $310,000 | $155,000 |
| 2022 | $11,309 | $465,000 | $310,000 | $155,000 |
| 2021 | $11,341 | $465,000 | $310,000 | $155,000 |
| 2020 | $11,253 | $465,000 | $310,000 | $155,000 |
| 2019 | $10,660 | $449,400 | $310,000 | $139,400 |
| 2018 | $10,417 | $446,700 | $310,000 | $136,700 |
| 2017 | $10,274 | $446,700 | $310,000 | $136,700 |
| 2016 | $10,113 | $446,700 | $310,000 | $136,700 |
| 2015 | $9,881 | $446,700 | $310,000 | $136,700 |
| 2014 | $9,760 | $446,700 | $310,000 | $136,700 |
Source: Public Records
Map
Nearby Homes
- 207 Mansgrove Rd
- 139 Laurel Rd
- 29 Dempsey Ave
- 339 Mount Lucas Rd
- 177 Terhune Rd
- 136 Red Hill Rd
- 47 Governors Ln
- 25 Governors Ln Unit 25
- 3 Governors Ln
- 6 Andrews Ln
- 169 Jefferson Rd Unit 171
- 265 Ewing St
- 341 Cherry Hill Rd
- 363 Cherry Hill Rd
- 374 Cherry Hill Rd
- 0 Cherry Hill Rd
- 380 Franklin Ave
- 35 Richard Ct
- 33 Jefferson Rd
- 75 Clover Ln
Your Personal Tour Guide
Ask me questions while you tour the home.