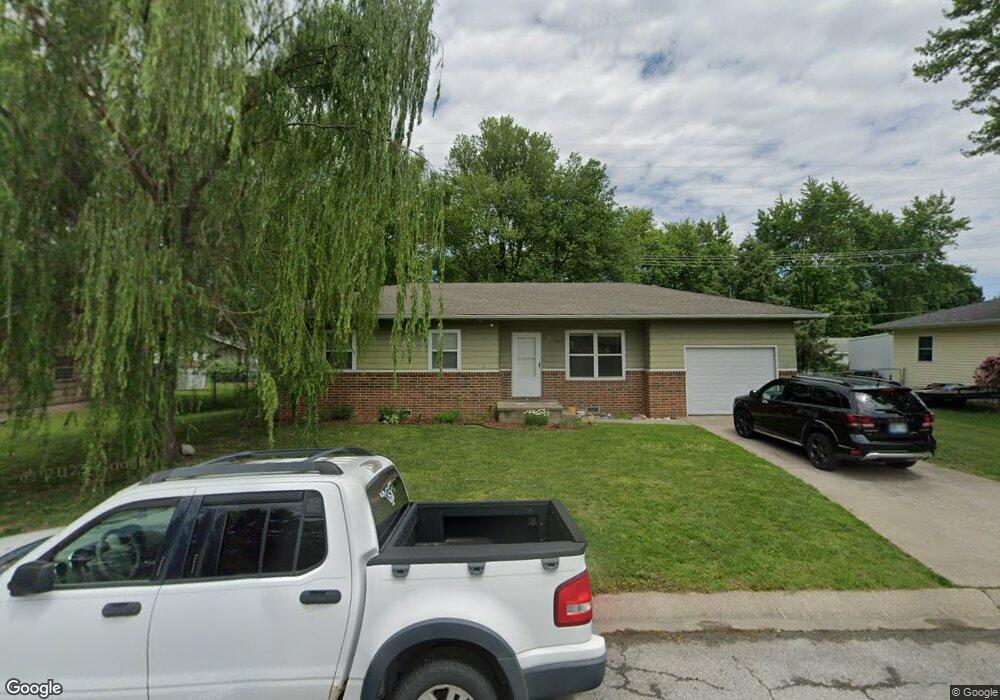
555 Steve St Carthage, MO 64836
Estimated Value: $144,000 - $160,000
3
Beds
1
Bath
1,089
Sq Ft
$138/Sq Ft
Est. Value
About This Home
This home is located at 555 Steve St, Carthage, MO 64836 and is currently estimated at $150,520, approximately $138 per square foot. 555 Steve St is a home located in Jasper County with nearby schools including Carthage High School, St. Ann's Catholic School, and Victory Academy.
Ownership History
Date
Name
Owned For
Owner Type
Purchase Details
Closed on
Jul 27, 2011
Sold by
Cade Lindsey and Cade Benjamin
Bought by
Nolting Nathaniel M and Belcher Tiffany M
Current Estimated Value
Home Financials for this Owner
Home Financials are based on the most recent Mortgage that was taken out on this home.
Original Mortgage
$73,225
Outstanding Balance
$50,242
Interest Rate
4.53%
Mortgage Type
FHA
Estimated Equity
$100,278
Purchase Details
Closed on
Aug 25, 2006
Sold by
Cole Julie A
Bought by
Brooks Lindsey
Home Financials for this Owner
Home Financials are based on the most recent Mortgage that was taken out on this home.
Original Mortgage
$71,500
Interest Rate
6.75%
Mortgage Type
Purchase Money Mortgage
Create a Home Valuation Report for This Property
The Home Valuation Report is an in-depth analysis detailing your home's value as well as a comparison with similar homes in the area
Home Values in the Area
Average Home Value in this Area
Purchase History
| Date | Buyer | Sale Price | Title Company |
|---|---|---|---|
| Nolting Nathaniel M | -- | Abbey | |
| Brooks Lindsey | -- | Abbey |
Source: Public Records
Mortgage History
| Date | Status | Borrower | Loan Amount |
|---|---|---|---|
| Open | Nolting Nathaniel M | $73,225 | |
| Previous Owner | Brooks Lindsey | $71,500 |
Source: Public Records
Tax History
| Year | Tax Paid | Tax Assessment Tax Assessment Total Assessment is a certain percentage of the fair market value that is determined by local assessors to be the total taxable value of land and additions on the property. | Land | Improvement |
|---|---|---|---|---|
| 2025 | $576 | $13,950 | $2,060 | $11,890 |
| 2024 | $576 | $11,190 | $2,060 | $9,130 |
| 2023 | $576 | $11,190 | $2,060 | $9,130 |
| 2022 | $591 | $11,520 | $2,060 | $9,460 |
| 2021 | $585 | $11,520 | $2,060 | $9,460 |
| 2020 | $565 | $10,670 | $2,060 | $8,610 |
| 2019 | $566 | $10,670 | $2,060 | $8,610 |
| 2018 | $597 | $11,290 | $0 | $0 |
| 2016 | $618 | $11,680 | $0 | $0 |
Source: Public Records
Map
Nearby Homes
- 2030 Forest Dr
- TBD Hazel Ave
- 2030 Forest St
- 510 W Fairview Ave
- 509 W Highland Ave
- 1830 S Maple St
- 1615 Forest St
- Tbd W George E Phelps Blvd
- 000 Annie Baxter & George Phelps
- 1732 Robertson Ave
- 1736 Robertson Ave
- 1716 Robertson Ave
- 1373 W Fairview Ave
- 2206 Benjamin Dr
- 1614 S Maple St
- 303 W Centennial Ave
- XXXX Clinton
- 1513 S Main St
- 1500 Robertson Ave
- NEC Fir Rd & Hazel Ave Unit Par 2
Your Personal Tour Guide
Ask me questions while you tour the home.