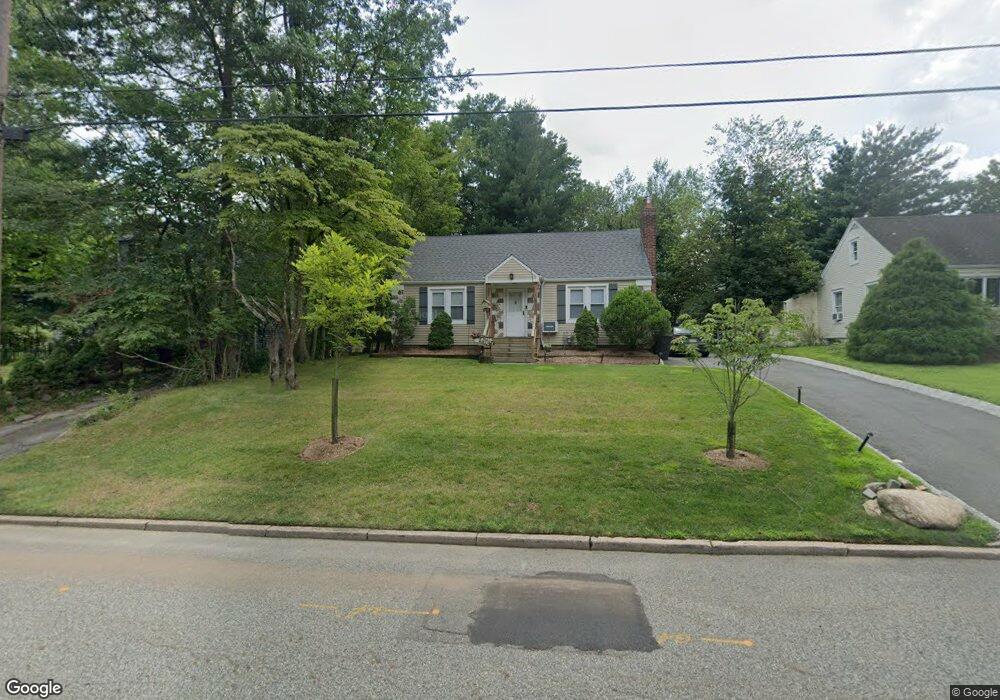
558 High St Closter, NJ 07624
Estimated Value: $717,493 - $778,000
Studio
--
Bath
1,688
Sq Ft
$439/Sq Ft
Est. Value
About This Home
This home is located at 558 High St, Closter, NJ 07624 and is currently estimated at $740,373, approximately $438 per square foot. 558 High St is a home located in Bergen County with nearby schools including Hillside Elementary School, Tenakill Middle School, and Northern Valley Regional High School at Demarest.
Ownership History
Date
Name
Owned For
Owner Type
Purchase Details
Closed on
Jul 26, 2021
Sold by
Camuso Karin and Ford Linda
Bought by
Ratcliff Scott and Ratcliff Karin
Current Estimated Value
Home Financials for this Owner
Home Financials are based on the most recent Mortgage that was taken out on this home.
Original Mortgage
$300,000
Interest Rate
3.12%
Mortgage Type
New Conventional
Purchase Details
Closed on
May 29, 2003
Sold by
Camuso Anthony
Bought by
Ford Linda
Create a Home Valuation Report for This Property
The Home Valuation Report is an in-depth analysis detailing your home's value as well as a comparison with similar homes in the area
Home Values in the Area
Average Home Value in this Area
Purchase History
| Date | Buyer | Sale Price | Title Company |
|---|---|---|---|
| Ratcliff Scott | -- | None Listed On Document | |
| Ford Linda | $91,500 | -- | |
| -- | $103,000 | -- |
Source: Public Records
Mortgage History
| Date | Status | Borrower | Loan Amount |
|---|---|---|---|
| Previous Owner | Ratcliff Scott | $300,000 |
Source: Public Records
Tax History
| Year | Tax Paid | Tax Assessment Tax Assessment Total Assessment is a certain percentage of the fair market value that is determined by local assessors to be the total taxable value of land and additions on the property. | Land | Improvement |
|---|---|---|---|---|
| 2025 | $11,054 | $573,300 | $392,400 | $180,900 |
| 2024 | $10,486 | $522,400 | $350,600 | $171,800 |
| 2023 | $10,478 | $489,100 | $321,900 | $167,200 |
| 2022 | $10,478 | $473,700 | $314,400 | $159,300 |
| 2021 | $10,442 | $453,200 | $301,900 | $151,300 |
| 2020 | $10,259 | $457,800 | $305,400 | $152,400 |
| 2019 | $10,001 | $451,100 | $300,900 | $150,200 |
| 2018 | $9,901 | $444,800 | $296,900 | $147,900 |
| 2017 | $9,746 | $427,100 | $283,300 | $143,800 |
| 2016 | $9,563 | $427,100 | $283,300 | $143,800 |
| 2015 | $9,353 | $427,100 | $283,300 | $143,800 |
| 2014 | $9,093 | $427,100 | $283,300 | $143,800 |
Source: Public Records
Map
Nearby Homes
Your Personal Tour Guide
Ask me questions while you tour the home.