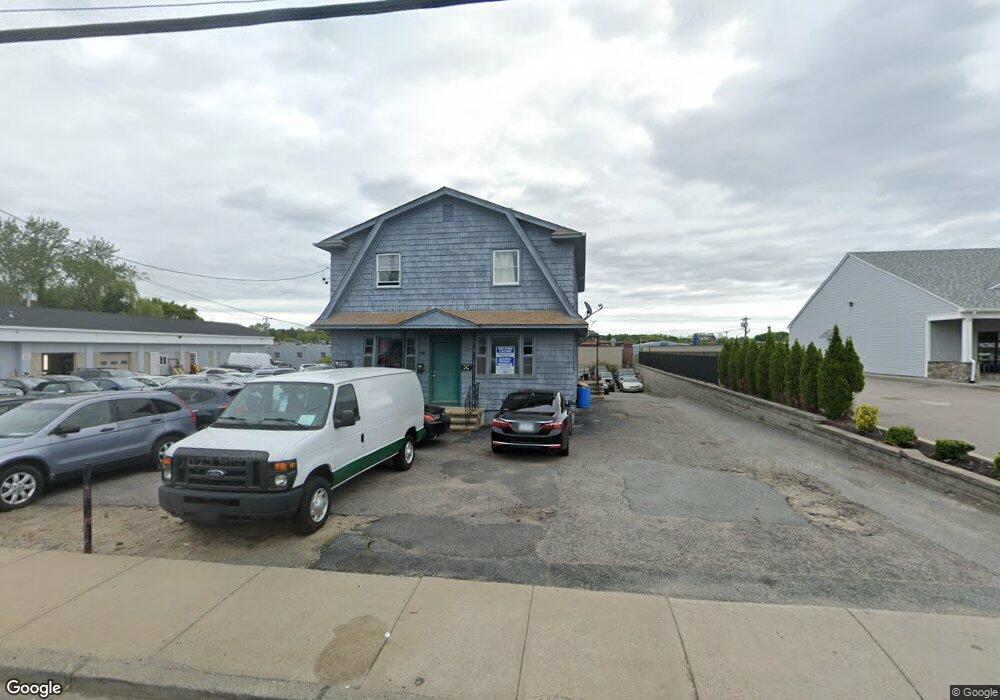
559 Killingly St Johnston, RI 02919
Killingly Street NeighborhoodEstimated Value: $585,068
3
Beds
2
Baths
2,842
Sq Ft
$206/Sq Ft
Est. Value
About This Home
This home is located at 559 Killingly St, Johnston, RI 02919 and is currently estimated at $585,068, approximately $205 per square foot. 559 Killingly St is a home located in Providence County with nearby schools including Johnston Senior High School, Achievement First Promesa, and Achievement First Providence Mayoral Academy Elementary School.
Ownership History
Date
Name
Owned For
Owner Type
Purchase Details
Closed on
Jun 17, 2025
Sold by
Xavier Investments Llc
Bought by
Overlook Ridge Llc
Current Estimated Value
Purchase Details
Closed on
Jun 16, 2017
Sold by
Adc Properties Llc
Bought by
Xavier Investments Llc
Purchase Details
Closed on
Jan 24, 2003
Sold by
559 Llc
Bought by
Cassisi Domenico and Cassisi Antonio M
Home Financials for this Owner
Home Financials are based on the most recent Mortgage that was taken out on this home.
Original Mortgage
$290,000
Interest Rate
6.11%
Mortgage Type
Commercial
Create a Home Valuation Report for This Property
The Home Valuation Report is an in-depth analysis detailing your home's value as well as a comparison with similar homes in the area
Home Values in the Area
Average Home Value in this Area
Purchase History
| Date | Buyer | Sale Price | Title Company |
|---|---|---|---|
| Overlook Ridge Llc | $600,000 | None Available | |
| Overlook Ridge Llc | $600,000 | None Available | |
| Xavier Investments Llc | -- | -- | |
| Xavier Investments Llc | -- | -- | |
| Xavier Investments Llc | -- | -- | |
| Cassisi Domenico | $320,000 | -- | |
| Cassisi Domenico | $320,000 | -- |
Source: Public Records
Mortgage History
| Date | Status | Borrower | Loan Amount |
|---|---|---|---|
| Previous Owner | Cassisi Domenico | $266,000 | |
| Previous Owner | Cassisi Domenico | $337,500 | |
| Previous Owner | Cassisi Domenico | $100,000 | |
| Previous Owner | Cassisi Domenico | $290,000 |
Source: Public Records
Tax History
| Year | Tax Paid | Tax Assessment Tax Assessment Total Assessment is a certain percentage of the fair market value that is determined by local assessors to be the total taxable value of land and additions on the property. | Land | Improvement |
|---|---|---|---|---|
| 2025 | $5,066 | $324,300 | $177,500 | $146,800 |
| 2024 | $4,962 | $324,300 | $177,500 | $146,800 |
| 2023 | $8,187 | $324,300 | $177,500 | $146,800 |
| 2022 | $8,187 | $305,600 | $161,100 | $144,500 |
| 2021 | $0 | $305,600 | $161,100 | $144,500 |
| 2018 | $8,187 | $297,800 | $153,300 | $144,500 |
| 2016 | $10,831 | $297,800 | $153,300 | $144,500 |
| 2015 | $8,378 | $289,000 | $153,300 | $135,700 |
| 2014 | $8,309 | $289,000 | $153,300 | $135,700 |
| 2013 | $8,309 | $289,000 | $153,300 | $135,700 |
Source: Public Records
Map
Nearby Homes
- 615 Killingly St
- 16 Homestead Ave
- 56 N Olney St
- 35 Hedley Ave
- 49 Highland Ave
- 27 Greenville Ave
- 46 Auburn Ave
- 0 Baltimore St
- 42 Archer Ave
- 46 Harrison St
- 25 Vermont St
- 44 Herschel St
- 43 Mcclellan St
- 74 Westcott Ave
- 0 Woodbine St
- 165 Borden Ave
- 102 Ophelia St
- 6 Stockwell St
- 54 Westcott Ave
- 61 Leander St
- 557 Killingly St
- 577 Killingly St
- 582 Killingly St
- 8 Dyerville Ave Unit A
- 8 Dyerville Ave
- 560 Killingly St
- 555 Killingly St
- 556 Killingly St
- 554 Killingly St
- 2 Leah St
- 24 Alcazar Ave
- 3 Meriline St
- 0 Sunnyside Ave
- 590 Killingly St
- 595 Killingly St
- 2 Oakdale Ave
- 542 Killingly St
- 10 Leah St
- 74 Elm St
- 19 Alcazar Ave
Your Personal Tour Guide
Ask me questions while you tour the home.