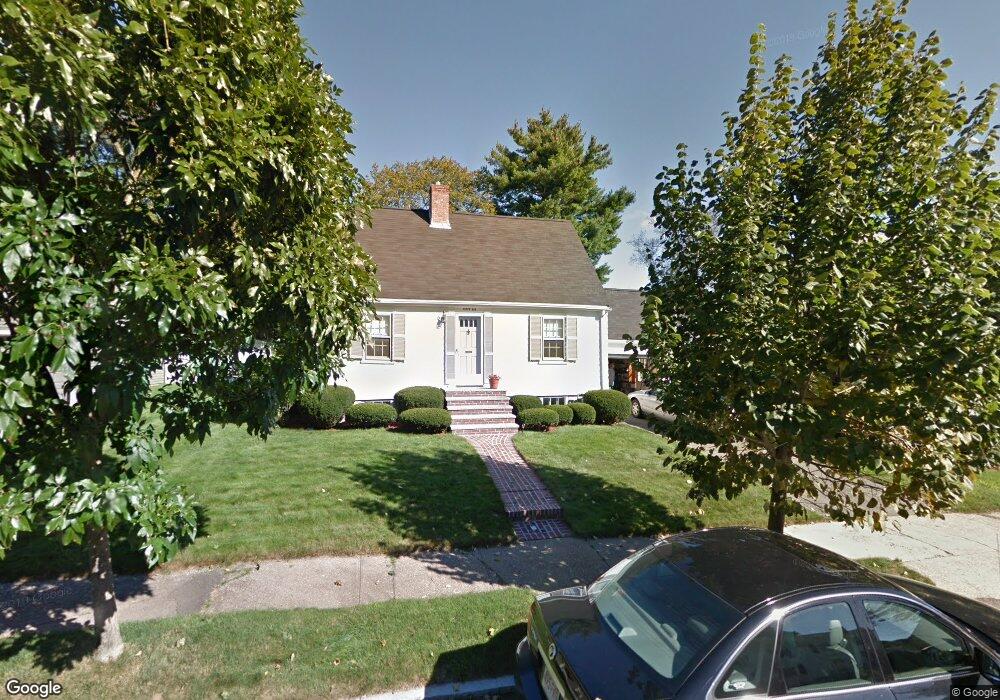
56 Aborn Ave Wakefield, MA 01880
Lakeside NeighborhoodEstimated Value: $687,831 - $871,000
2
Beds
2
Baths
1,320
Sq Ft
$580/Sq Ft
Est. Value
About This Home
This home is located at 56 Aborn Ave, Wakefield, MA 01880 and is currently estimated at $765,458, approximately $579 per square foot. 56 Aborn Ave is a home located in Middlesex County with nearby schools including Wakefield Memorial High School, St Joseph School, and Odyssey Day School.
Ownership History
Date
Name
Owned For
Owner Type
Purchase Details
Closed on
Dec 17, 2008
Sold by
Donovan Mark E
Bought by
Hearn Carol M and Hearn Thomas P
Current Estimated Value
Home Financials for this Owner
Home Financials are based on the most recent Mortgage that was taken out on this home.
Original Mortgage
$225,000
Outstanding Balance
$149,682
Interest Rate
6.27%
Mortgage Type
Purchase Money Mortgage
Estimated Equity
$615,776
Create a Home Valuation Report for This Property
The Home Valuation Report is an in-depth analysis detailing your home's value as well as a comparison with similar homes in the area
Home Values in the Area
Average Home Value in this Area
Purchase History
| Date | Buyer | Sale Price | Title Company |
|---|---|---|---|
| Hearn Carol M | $375,000 | -- |
Source: Public Records
Mortgage History
| Date | Status | Borrower | Loan Amount |
|---|---|---|---|
| Open | Hearn Carol M | $225,000 |
Source: Public Records
Tax History
| Year | Tax Paid | Tax Assessment Tax Assessment Total Assessment is a certain percentage of the fair market value that is determined by local assessors to be the total taxable value of land and additions on the property. | Land | Improvement |
|---|---|---|---|---|
| 2025 | $7,133 | $628,500 | $394,500 | $234,000 |
| 2024 | $7,203 | $640,300 | $401,900 | $238,400 |
| 2023 | $6,846 | $583,600 | $366,300 | $217,300 |
| 2022 | $6,363 | $516,500 | $324,200 | $192,300 |
| 2021 | $6,135 | $481,900 | $299,500 | $182,400 |
| 2020 | $5,701 | $446,400 | $277,400 | $169,000 |
| 2019 | $5,495 | $428,300 | $266,200 | $162,100 |
| 2018 | $5,227 | $403,600 | $250,800 | $152,800 |
| 2017 | $4,985 | $382,600 | $237,700 | $144,900 |
| 2016 | $4,717 | $349,700 | $217,600 | $132,100 |
| 2015 | $4,625 | $343,100 | $213,500 | $129,600 |
| 2014 | $4,216 | $329,900 | $205,300 | $124,600 |
Source: Public Records
Map
Nearby Homes
- 57 Wave Ave
- 29 Cordis St
- 11 Lawrence St
- 20 Lawrence St Unit 2
- 284 Lowell St
- 67 Woodcrest Dr
- 17 Preston St
- 43-45 Crescent St
- 22 Indian Hill Rd
- 13 Chestnut St Unit 1
- 10 Wakefield Ave Unit B
- 11 Columbia Rd Unit 7
- 9 Cyrus St
- 24 W Water St
- 50 Tuttle St Unit 12
- 3 Western Ave
- 35 Richardson St Unit 2
- 17 Collins Rd
- 50 Quannapowitt Pkwy
- 62 Foundry St Unit 310
Your Personal Tour Guide
Ask me questions while you tour the home.