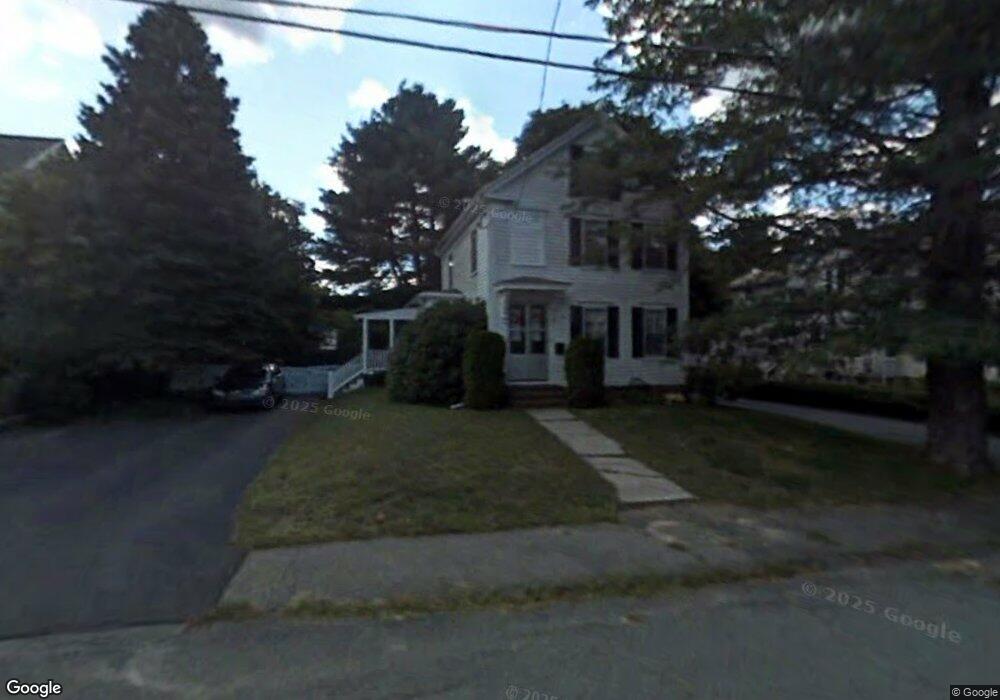
56 Adams St Holbrook, MA 02343
Estimated Value: $451,000 - $538,000
3
Beds
1
Bath
1,484
Sq Ft
$336/Sq Ft
Est. Value
About This Home
This home is located at 56 Adams St, Holbrook, MA 02343 and is currently estimated at $498,774, approximately $336 per square foot. 56 Adams St is a home located in Norfolk County with nearby schools including John F. Kennedy Elementary School, Holbrook Middle High School, and Boston Higashi School.
Ownership History
Date
Name
Owned For
Owner Type
Purchase Details
Closed on
Feb 27, 1991
Sold by
Grieb John R
Bought by
Caldwell Keith R and Caldwell Janice M
Current Estimated Value
Home Financials for this Owner
Home Financials are based on the most recent Mortgage that was taken out on this home.
Original Mortgage
$118,643
Interest Rate
9.69%
Mortgage Type
Purchase Money Mortgage
Purchase Details
Closed on
Jan 29, 1988
Sold by
Adams Street Rt
Bought by
Grieb John R
Create a Home Valuation Report for This Property
The Home Valuation Report is an in-depth analysis detailing your home's value as well as a comparison with similar homes in the area
Home Values in the Area
Average Home Value in this Area
Purchase History
We collect this data history from publicly available records. To have your information removed, we recommend requesting removal directly through your county’s website.
| Date | Buyer | Sale Price | Title Company |
|---|---|---|---|
| Caldwell Keith R | $118,000 | -- | |
| Caldwell Keith R | $118,000 | -- | |
| Grieb John R | $115,000 | -- |
Source: Public Records
Mortgage History
We collect this data history from publicly available records. To have your information removed, we recommend requesting removal directly through your county’s website.
| Date | Status | Borrower | Loan Amount |
|---|---|---|---|
| Open | Grieb John R | $74,000 | |
| Closed | Grieb John R | $118,022 | |
| Closed | Grieb John R | $118,643 |
Source: Public Records
Tax History
| Year | Tax Paid | Tax Assessment Tax Assessment Total Assessment is a certain percentage of the fair market value that is determined by local assessors to be the total taxable value of land and additions on the property. | Land | Improvement |
|---|---|---|---|---|
| 2025 | $56 | $423,200 | $217,000 | $206,200 |
| 2024 | $5,016 | $373,200 | $199,300 | $173,900 |
| 2023 | $5,229 | $340,000 | $175,600 | $164,400 |
| 2022 | $4,985 | $302,300 | $157,000 | $145,300 |
| 2021 | $4,813 | $279,500 | $142,700 | $136,800 |
| 2020 | $4,962 | $270,100 | $138,600 | $131,500 |
| 2019 | $5,052 | $259,600 | $131,900 | $127,700 |
| 2018 | $4,905 | $237,300 | $113,800 | $123,500 |
| 2017 | $4,617 | $220,900 | $103,800 | $117,100 |
| 2016 | $4,093 | $208,400 | $100,800 | $107,600 |
| 2015 | $3,780 | $198,100 | $94,800 | $103,300 |
| 2014 | $3,437 | $183,100 | $79,800 | $103,300 |
Source: Public Records
Map
Nearby Homes
- 43 Plymouth St
- 27 Morgan Rd
- 30 Roseen Rd
- 148 N Franklin St
- 14 Elm Ave
- 4 Ell Rd
- 9 Sunset Ave
- 5 Clarendon Cir Unit Lot 4
- 39 Marion St
- 38 Marion St
- 47 Mount Pleasant Ave
- 35 Hillsdale Rd
- 484 S Franklin St
- 25 Lakeview Ave
- 266 N Franklin St Unit 266A
- 15 Jefferson Rd
- 610 S Franklin St Unit F101
- 499 South St
- 640 Plymouth St
- 45 Ernest St
Your Personal Tour Guide
Ask me questions while you tour the home.