56 Black Point Rd Rumson, NJ 07760
Estimated Value: $1,421,000 - $1,487,000
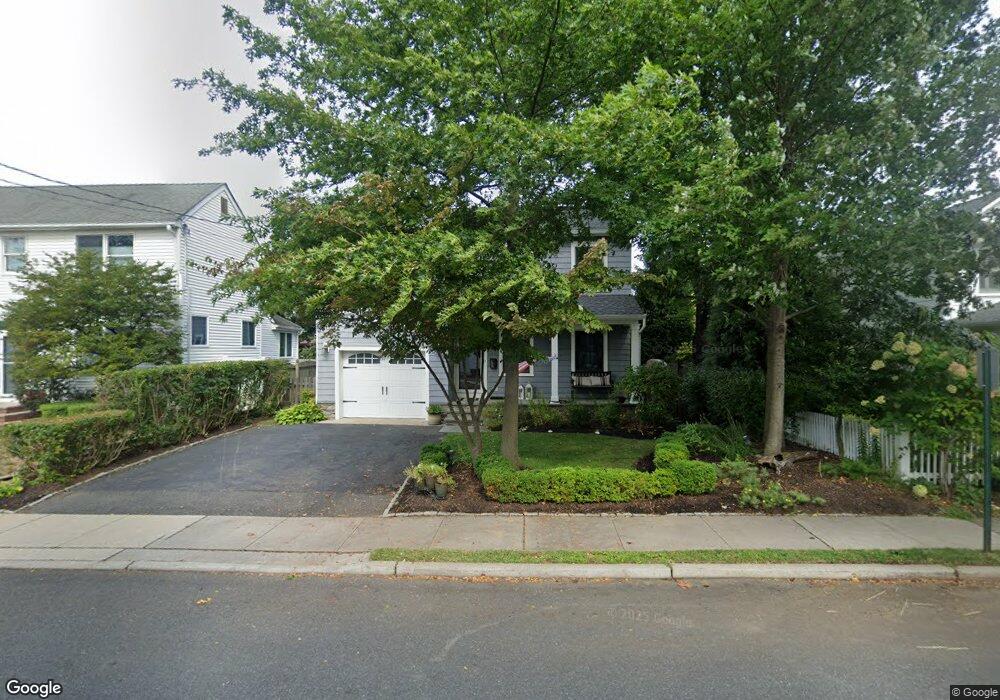
About This Home
This home is located at 56 Black Point Rd, Rumson, NJ 07760 and is currently estimated at $1,448,106, approximately $716 per square foot. 56 Black Point Rd is a home located in Monmouth County with nearby schools including Deane Porter School, Forrestdale School, and Rumson Fair Haven Regional High School.
Ownership History
We collect this data history from publicly available records. To have your information removed, we recommend requesting removal directly through your county’s website.
Purchase Details
Home Financials for this Owner
Home Financials are based on the most recent Mortgage that was taken out on this home.Home Values in the Area
Average Home Value in this Area
Purchase History
We collect this data history from publicly available records. To have your information removed, we recommend requesting removal directly through your county’s website.
| Date | Buyer | Sale Price | Title Company |
|---|---|---|---|
| $695,000 | The Title Company Of Jersey |
Mortgage History
We collect this data history from publicly available records. To have your information removed, we recommend requesting removal directly through your county’s website.
| Date | Status | Borrower | Loan Amount |
|---|---|---|---|
| Open | $550,000 |
Tax History
We collect this data history from publicly available records. To have your information removed, we recommend requesting removal directly through your county’s website.
| Year | Tax Paid | Tax Assessment Tax Assessment Total Assessment is a certain percentage of the fair market value that is determined by local assessors to be the total taxable value of land and additions on the property. | Land | Improvement |
|---|---|---|---|---|
| 2025 | $11,310 | $1,118,900 | $719,200 | $399,700 |
| 2024 | $11,317 | $1,028,200 | $664,400 | $363,800 |
| 2023 | $11,317 | $968,100 | $638,300 | $329,800 |
| 2022 | $10,994 | $878,500 | $568,700 | $309,800 |
| 2021 | $10,994 | $772,600 | $492,800 | $279,800 |
| 2020 | $10,237 | $714,400 | $448,000 | $266,400 |
| 2019 | $10,064 | $685,100 | $310,000 | $375,100 |
| 2018 | $9,895 | $667,700 | $310,000 | $357,700 |
| 2017 | $9,134 | $621,800 | $275,000 | $346,800 |
| 2016 | $8,738 | $609,800 | $275,000 | $334,800 |
| 2015 | $8,641 | $594,700 | $275,000 | $319,700 |
| 2014 | $8,467 | $581,100 | $270,000 | $311,100 |
Map
- 24 Bingham Ct
- 11 Bingham Ct
- 13 Bingham Ct
- 26 Bingham Ct
- 11 Bruce Place
- 10 Lakeside Ave
- 1 N Cherry Ln
- 22 Ridge Rd
- 48 Allen St
- 8 Evergreen Dr
- 83 Ridge Rd
- 14 Ridge Rd
- 8 Holly Tree Ln
- 5 Oakwood Ln
- 142 Black Point Rd Unit H9
- 2 Alyce Ln
- 1 2nd St
- 1 Lauriston Ct
- 3 Black Point Horseshoe Unit LAND
- 3 Black Point Horseshoe
- 58 Black Point Rd
- 60 Black Point Rd
- 54 Black Point Rd
- 62 Black Point Rd
- 11 West St
- 9 West St
- 7 West St
- 77 Forrest Ave
- 52 Black Point Rd
- 5 West St
- 64 Black Point Rd
- 61 Black Point Rd
- 13 West St
- 63 Black Point Rd
- 59 Black Point Rd
- 3 West St
- 57 Black Point Rd
- 65 Black Point Rd
- 66 Black Point Rd
- 67 Black Point Rd
Ask me questions while you tour the home.