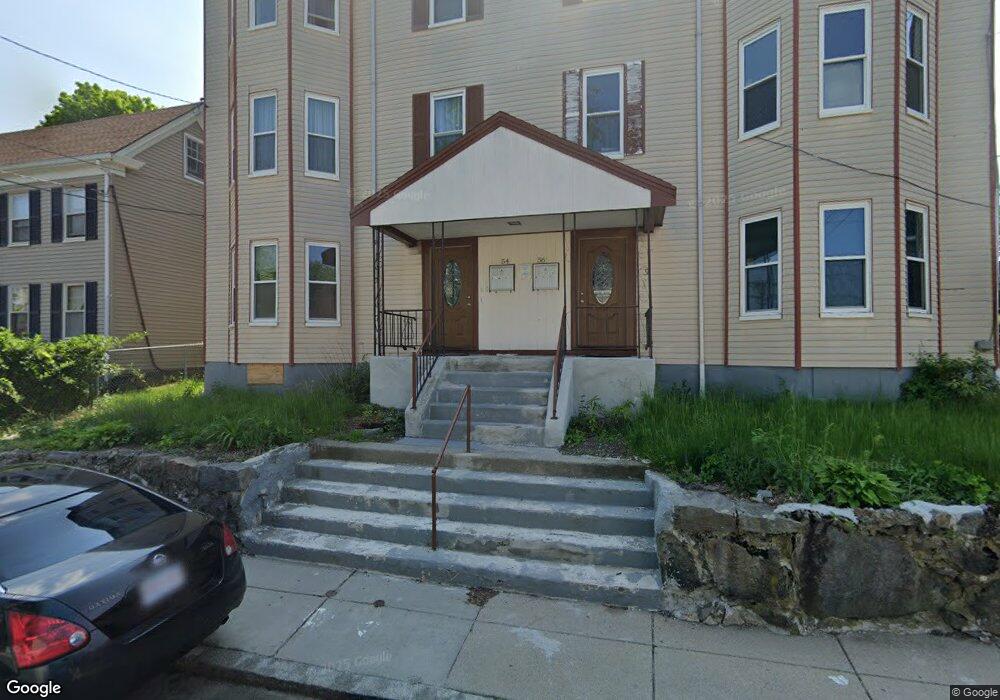
56 Cedar St Unit 1 Mattapan, MA 02126
West Codman Hill-West Lowe NeighborhoodEstimated Value: $334,893 - $482,000
3
Beds
1
Bath
900
Sq Ft
$445/Sq Ft
Est. Value
About This Home
This home is located at 56 Cedar St Unit 1, Mattapan, MA 02126 and is currently estimated at $400,473, approximately $444 per square foot. 56 Cedar St Unit 1 is a home located in Suffolk County with nearby schools including Conservatory Lab Upper School and Saint John Paul II Catholic Academy.
Ownership History
Date
Name
Owned For
Owner Type
Purchase Details
Closed on
Aug 1, 2022
Sold by
Okoli Chuks C
Bought by
Okoli Rt and Okoli
Current Estimated Value
Purchase Details
Closed on
Dec 21, 2004
Sold by
New 54-56 Cedar St Rt and Krieger
Bought by
Okoli Chuks
Home Financials for this Owner
Home Financials are based on the most recent Mortgage that was taken out on this home.
Original Mortgage
$187,500
Interest Rate
5.68%
Mortgage Type
Purchase Money Mortgage
Purchase Details
Closed on
Dec 14, 2004
Sold by
New 54-56 Cedar St Rt and Cedar St Condo 54-56
Bought by
Levine Eric L
Home Financials for this Owner
Home Financials are based on the most recent Mortgage that was taken out on this home.
Original Mortgage
$187,500
Interest Rate
5.68%
Mortgage Type
Purchase Money Mortgage
Purchase Details
Closed on
Nov 30, 2004
Sold by
Cedar St Rt 54-56 and Okoli
Bought by
Okoli Chuks
Home Financials for this Owner
Home Financials are based on the most recent Mortgage that was taken out on this home.
Original Mortgage
$187,500
Interest Rate
5.68%
Mortgage Type
Purchase Money Mortgage
Create a Home Valuation Report for This Property
The Home Valuation Report is an in-depth analysis detailing your home's value as well as a comparison with similar homes in the area
Home Values in the Area
Average Home Value in this Area
Purchase History
We collect this data history from publicly available records. To have your information removed, we recommend requesting removal directly through your county’s website.
| Date | Buyer | Sale Price | Title Company |
|---|---|---|---|
| Okoli Rt | -- | None Available | |
| Okoli Chuks | $250,000 | -- | |
| Krieger Louis | $250,000 | -- | |
| Levine Eric L | $250,000 | -- | |
| Okoli Chuks | $250,000 | -- |
Source: Public Records
Mortgage History
We collect this data history from publicly available records. To have your information removed, we recommend requesting removal directly through your county’s website.
| Date | Status | Borrower | Loan Amount |
|---|---|---|---|
| Previous Owner | Okoli Chuks | $193,900 | |
| Previous Owner | Okoli Chuks | $187,500 | |
| Previous Owner | Okoli Chuks | $200,000 |
Source: Public Records
Tax History
| Year | Tax Paid | Tax Assessment Tax Assessment Total Assessment is a certain percentage of the fair market value that is determined by local assessors to be the total taxable value of land and additions on the property. | Land | Improvement |
|---|---|---|---|---|
| 2025 | $3,247 | $280,400 | $0 | $280,400 |
| 2024 | $3,218 | $295,200 | $0 | $295,200 |
| 2023 | $3,077 | $286,500 | $0 | $286,500 |
| 2022 | $2,967 | $272,700 | $0 | $272,700 |
| 2021 | $2,825 | $264,800 | $0 | $264,800 |
| 2020 | $2,270 | $215,000 | $0 | $215,000 |
| 2019 | $2,119 | $201,000 | $0 | $201,000 |
| 2018 | $2,006 | $191,400 | $0 | $191,400 |
| 2017 | $1,949 | $184,000 | $0 | $184,000 |
| 2016 | $1,857 | $168,800 | $0 | $168,800 |
| 2015 | $1,568 | $129,500 | $0 | $129,500 |
| 2014 | $1,551 | $123,300 | $0 | $123,300 |
Source: Public Records
Map
Nearby Homes
- 23-27 Cedar St Unit 25
- 23-27 Cedar St Unit 27
- 1103 Morton St
- 96 Standard St
- 23 Maryknoll St
- 54 River St Unit 2
- 21 Tanglewood Rd Unit 3
- 21 Tanglewood Rd Unit 2
- 15 Tanglewood Rd Unit B
- 1069 Washington St Unit 2
- 14 Avondale St
- 67 Maple St
- 1241-1255 Adams St Unit F507
- 36 Saint Gregory St Unit 38
- 38 Saint Gregory St
- 244 Eliot St Unit 2
- 1245 Adams St Unit B210
- 1243 Adams St Unit PM207
- 24 School St
- 106 Central Ave
- 56 Cedar St Unit 3
- 56 Cedar St Unit 2
- 56 Cedar St
- 54 Cedar St Unit 3
- 54 Cedar St Unit 2
- 54 Cedar St Unit 1
- 52 Cedar St
- 50-52 Cedar St
- 54-56 Cedar St Unit 56-2
- 54-56 Cedar St Unit 1
- 55 Idaho St
- 55 Idaho St Unit 1
- 55 Idaho St Unit 3
- 48 Cedar St
- 58 Cedar St Unit 60
- 53 Cedar St
- 59 Idaho St
- 47-49 Cedar Unit 1
- 47-49 Cedar
- 42 Cedar St Unit 46R
Your Personal Tour Guide
Ask me questions while you tour the home.