56 Cedar St Norwich, CT 06360
Central Norwich NeighborhoodEstimated Value: $84,000 - $244,000
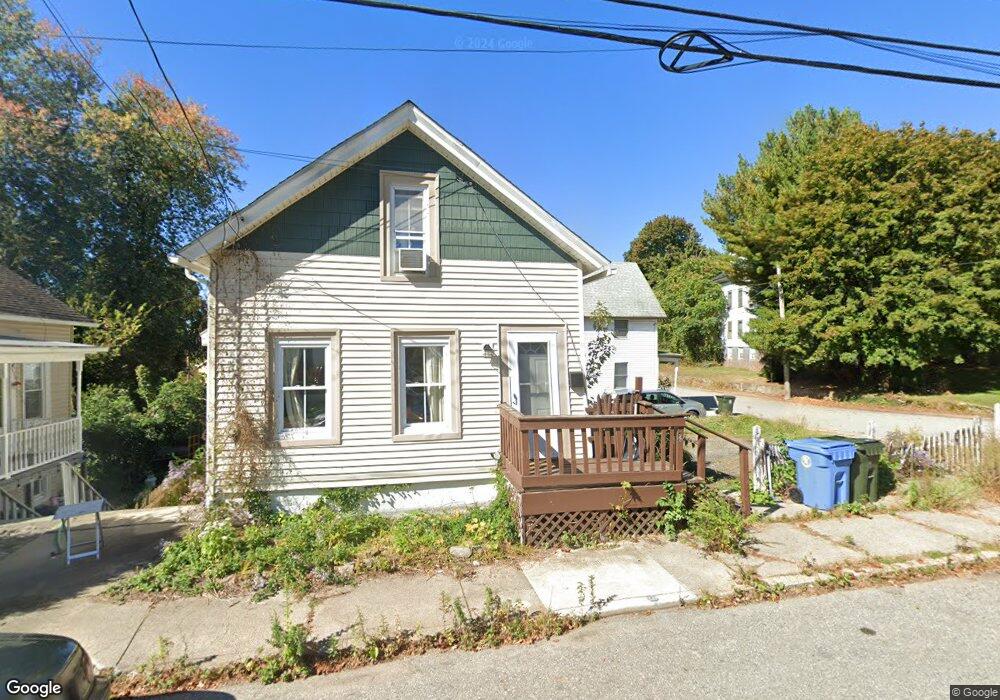
About This Home
This home is located at 56 Cedar St, Norwich, CT 06360 and is currently estimated at $179,736, approximately $255 per square foot. 56 Cedar St is a home located in New London County with nearby schools including Samuel Huntington Elementary School, Kelly STEAM Magnet Middle School, and Integrated Day Charter School.
Ownership History
We collect this data history from publicly available records. To have your information removed, we recommend requesting removal directly through your county’s website.
Purchase Details
Purchase Details
Purchase Details
Purchase Details
Purchase Details
Home Values in the Area
Average Home Value in this Area
Purchase History
We collect this data history from publicly available records. To have your information removed, we recommend requesting removal directly through your county’s website.
| Date | Buyer | Sale Price | Title Company |
|---|---|---|---|
| -- | None Available | ||
| -- | None Available | ||
| -- | None Available | ||
| -- | None Available | ||
| $46,500 | None Available | ||
| $46,500 | None Available | ||
| -- | -- | ||
| -- | -- | ||
| $89,000 | -- | ||
| $89,000 | -- |
Mortgage History
We collect this data history from publicly available records. To have your information removed, we recommend requesting removal directly through your county’s website.
| Date | Status | Borrower | Loan Amount |
|---|---|---|---|
| Previous Owner | $65,000 |
Tax History
We collect this data history from publicly available records. To have your information removed, we recommend requesting removal directly through your county’s website.
| Year | Tax Paid | Tax Assessment Tax Assessment Total Assessment is a certain percentage of the fair market value that is determined by local assessors to be the total taxable value of land and additions on the property. | Land | Improvement |
|---|---|---|---|---|
| 2025 | $2,910 | $71,900 | $20,700 | $51,200 |
| 2024 | $2,747 | $71,900 | $20,700 | $51,200 |
| 2023 | $2,223 | $45,700 | $14,600 | $31,100 |
| 2022 | $2,216 | $45,700 | $14,600 | $31,100 |
| 2021 | $2,223 | $45,700 | $14,600 | $31,100 |
| 2020 | $2,215 | $45,700 | $14,600 | $31,100 |
| 2019 | $2,193 | $45,700 | $14,600 | $31,100 |
| 2018 | $2,361 | $48,800 | $17,200 | $31,600 |
| 2017 | $2,379 | $48,800 | $17,200 | $31,600 |
| 2016 | $2,394 | $48,800 | $17,200 | $31,600 |
| 2015 | $2,345 | $48,800 | $17,200 | $31,600 |
| 2014 | $2,241 | $48,800 | $17,200 | $31,600 |
Map
- 41 Fountain St
- 35 Harbor View Ln
- 22 Fountain St
- 24 John St
- 4 Harbor View Ln Unit 4
- 21 Buckingham Ave
- 9 Washington St
- 202 Broadway
- 2 Broadway Terrace
- 14 Sturtevant Ave
- 23 Sturtevant Ave
- 10 Goldberg Ave
- 40 Maple Grove Ave
- 7 Broad St
- 226 Broadway
- 11 Oak St
- 20 Summer St
- 7 Mckinley Ave
- 11 Division St
- 21 Fairmount St
Ask me questions while you tour the home.