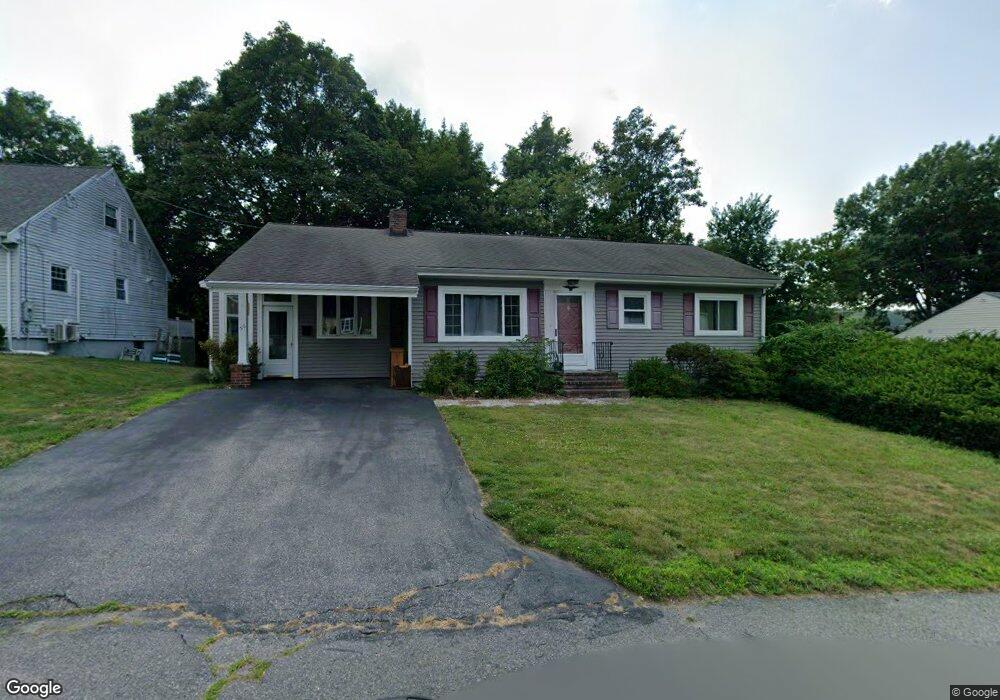
56 Glenn Rd Lowell, MA 01852
Belvidere NeighborhoodEstimated Value: $547,000 - $618,000
About This Home
This home is located at 56 Glenn Rd, Lowell, MA 01852 and is currently estimated at $576,537, approximately $411 per square foot. 56 Glenn Rd is a home located in Middlesex County with nearby schools including Moody Elementary School, Greenhalge Elementary School, and Abraham Lincoln Elementary School.
Ownership History
We collect this data history from publicly available records. To have your information removed, we recommend requesting removal directly through your county’s website.
Purchase Details
Home Values in the Area
Average Home Value in this Area
Purchase History
We collect this data history from publicly available records. To have your information removed, we recommend requesting removal directly through your county’s website.
| Date | Buyer | Sale Price | Title Company |
|---|---|---|---|
| $120,000 | -- |
Mortgage History
We collect this data history from publicly available records. To have your information removed, we recommend requesting removal directly through your county’s website.
| Date | Status | Borrower | Loan Amount |
|---|---|---|---|
| Open | $174,717 | ||
| Closed | $164,000 | ||
| Closed | $138,800 | ||
| Closed | $99,500 | ||
| Closed | $30,000 |
Tax History
We collect this data history from publicly available records. To have your information removed, we recommend requesting removal directly through your county’s website.
| Year | Tax Paid | Tax Assessment Tax Assessment Total Assessment is a certain percentage of the fair market value that is determined by local assessors to be the total taxable value of land and additions on the property. | Land | Improvement |
|---|---|---|---|---|
| 2025 | $5,326 | $463,900 | $211,300 | $252,600 |
| 2024 | $5,043 | $423,400 | $197,500 | $225,900 |
| 2023 | $4,777 | $384,600 | $171,700 | $212,900 |
| 2022 | $4,275 | $336,900 | $156,100 | $180,800 |
| 2021 | $4,222 | $313,700 | $135,800 | $177,900 |
| 2020 | $3,921 | $293,500 | $135,800 | $157,700 |
| 2019 | $3,989 | $284,100 | $135,100 | $149,000 |
| 2018 | $3,636 | $252,700 | $128,700 | $124,000 |
| 2017 | $3,552 | $238,100 | $119,500 | $118,600 |
| 2016 | $3,120 | $205,800 | $109,900 | $95,900 |
| 2015 | $3,147 | $203,300 | $109,900 | $93,400 |
| 2013 | $3,013 | $200,700 | $121,300 | $79,400 |
Map
- 35 Barasford Ave
- 633 E Merrimack St
- 631 E Merrimack St
- 21 Guild St
- 333 First Street Blvd Unit 209
- 50 Wentworth Ave
- 558 E Merrimack St Unit 34
- 105 Stafford Rd
- 52 Christian St
- 82 Christian St
- 105 Starr Ave
- 112 Durant St
- 81 Reservoir St
- 62 Parkview Ave
- 32 Belmont Ave
- 305 Andover St
- 192 Wentworth Ave
- 223 Stackpole St
- 192 1st St
- 10 Haverhill St
- 727 E Merrimack St
- 733 E Merrimack St
- 713 E Merrimack St
- 713 E Merrimack St
- 53 Daniels St
- 66 Glenn Rd
- 78 Glenn Rd
- 60 Daniels St
- 722 E Merrimack St
- 722 E Merrimack St Unit 1
- 728 E Merrimack St
- 49 Daniels St
- 714 E Merrimack St
- 54 Daniels St
- 736 E Merrimack St
- 744 E Merrimack St
- 52 Glenn Rd
- 706 E Merrimack St
- 755 E Merrimack St
- 61 Glenn Rd
Ask me questions while you tour the home.