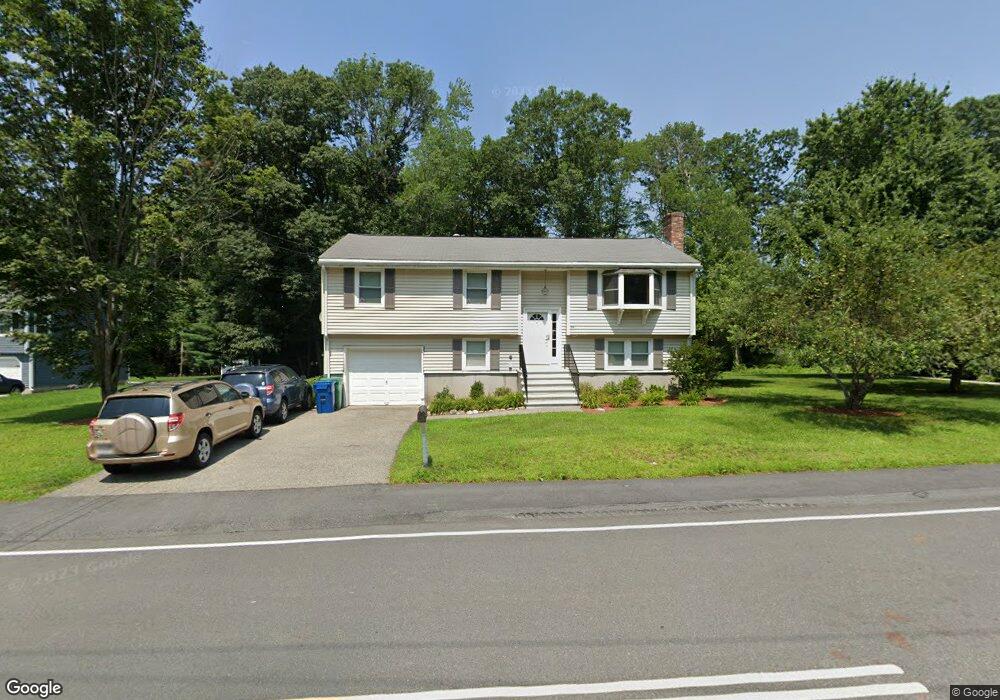
56 Westwood St Burlington, MA 01803
North Burlington NeighborhoodEstimated Value: $807,543 - $880,000
3
Beds
2
Baths
1,800
Sq Ft
$468/Sq Ft
Est. Value
About This Home
This home is located at 56 Westwood St, Burlington, MA 01803 and is currently estimated at $841,636, approximately $467 per square foot. 56 Westwood St is a home located in Middlesex County with nearby schools including Burlington High School, Fox Hill, and Marshall Simonds Middle School.
Ownership History
Date
Name
Owned For
Owner Type
Purchase Details
Closed on
Jun 3, 2003
Sold by
Nash Stewart
Bought by
Wilshusen Eric
Current Estimated Value
Home Financials for this Owner
Home Financials are based on the most recent Mortgage that was taken out on this home.
Original Mortgage
$236,000
Outstanding Balance
$97,685
Interest Rate
5.86%
Mortgage Type
Purchase Money Mortgage
Estimated Equity
$743,951
Purchase Details
Closed on
May 31, 1994
Sold by
Johnson Thomas
Bought by
Nash Stewart
Home Financials for this Owner
Home Financials are based on the most recent Mortgage that was taken out on this home.
Original Mortgage
$143,900
Interest Rate
8.22%
Mortgage Type
Purchase Money Mortgage
Create a Home Valuation Report for This Property
The Home Valuation Report is an in-depth analysis detailing your home's value as well as a comparison with similar homes in the area
Home Values in the Area
Average Home Value in this Area
Purchase History
| Date | Buyer | Sale Price | Title Company |
|---|---|---|---|
| Wilshusen Eric | $402,000 | -- | |
| Nash Stewart | $179,900 | -- |
Source: Public Records
Mortgage History
| Date | Status | Borrower | Loan Amount |
|---|---|---|---|
| Open | Wilshusen Eric | $236,000 | |
| Previous Owner | Nash Stewart | $143,900 |
Source: Public Records
Tax History
| Year | Tax Paid | Tax Assessment Tax Assessment Total Assessment is a certain percentage of the fair market value that is determined by local assessors to be the total taxable value of land and additions on the property. | Land | Improvement |
|---|---|---|---|---|
| 2025 | $6,235 | $720,000 | $425,100 | $294,900 |
| 2024 | $6,089 | $681,100 | $403,100 | $278,000 |
| 2023 | $5,843 | $621,600 | $350,100 | $271,500 |
| 2022 | $5,712 | $574,100 | $319,100 | $255,000 |
| 2021 | $5,424 | $545,100 | $290,100 | $255,000 |
| 2020 | $5,271 | $546,800 | $290,100 | $256,700 |
| 2019 | $5,206 | $496,800 | $271,100 | $225,700 |
| 2018 | $4,860 | $457,600 | $258,100 | $199,500 |
| 2017 | $4,625 | $457,600 | $258,100 | $199,500 |
| 2016 | $4,584 | $400,000 | $220,100 | $179,900 |
| 2015 | $4,540 | $400,000 | $220,100 | $179,900 |
| 2014 | $4,412 | $367,700 | $200,100 | $167,600 |
Source: Public Records
Map
Nearby Homes
Your Personal Tour Guide
Ask me questions while you tour the home.