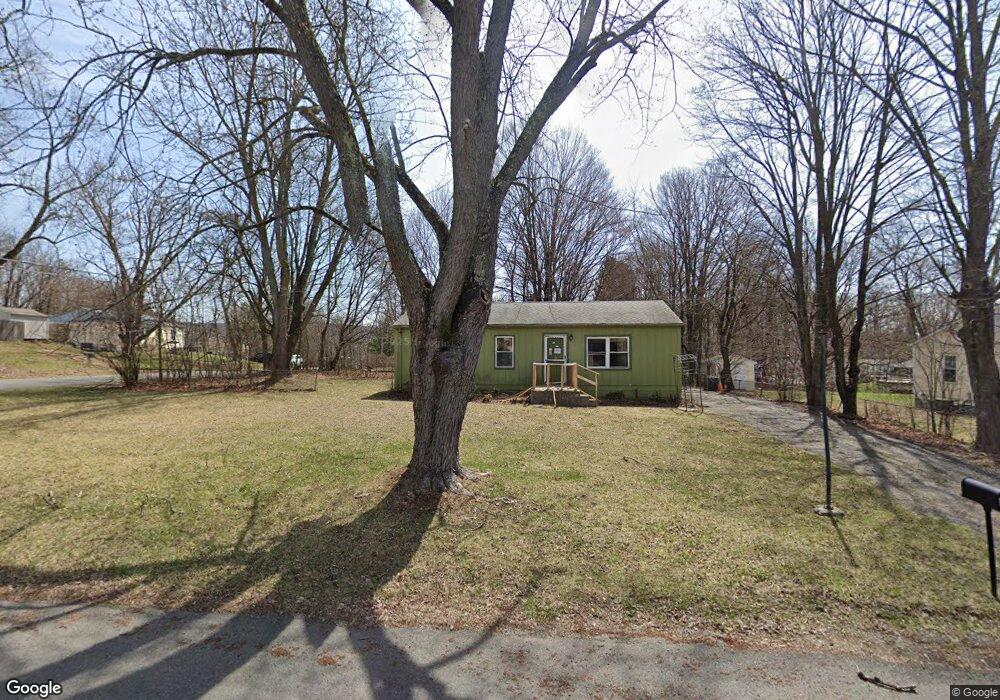
56 Wickham Dr Warwick, NY 10990
Estimated Value: $391,983 - $423,000
3
Beds
1
Bath
1,025
Sq Ft
$401/Sq Ft
Est. Value
About This Home
This home is located at 56 Wickham Dr, Warwick, NY 10990 and is currently estimated at $411,496, approximately $401 per square foot. 56 Wickham Dr is a home located in Orange County with nearby schools including Warwick Valley Middle School and Warwick Valley High School.
Ownership History
Date
Name
Owned For
Owner Type
Purchase Details
Closed on
Sep 22, 2004
Sold by
Saunders Steven
Bought by
Saunders Steven
Current Estimated Value
Purchase Details
Closed on
Dec 3, 2001
Sold by
Richardson Wade and Richardson Laura
Bought by
Saunders Steven and Saunders Ena
Home Financials for this Owner
Home Financials are based on the most recent Mortgage that was taken out on this home.
Original Mortgage
$144,000
Interest Rate
6.67%
Mortgage Type
Purchase Money Mortgage
Create a Home Valuation Report for This Property
The Home Valuation Report is an in-depth analysis detailing your home's value as well as a comparison with similar homes in the area
Home Values in the Area
Average Home Value in this Area
Purchase History
| Date | Buyer | Sale Price | Title Company |
|---|---|---|---|
| Saunders Steven | -- | -- | |
| Saunders Steven | $148,500 | Fidelity National Title Ins |
Source: Public Records
Mortgage History
| Date | Status | Borrower | Loan Amount |
|---|---|---|---|
| Previous Owner | Saunders Steven | $144,000 |
Source: Public Records
Tax History
| Year | Tax Paid | Tax Assessment Tax Assessment Total Assessment is a certain percentage of the fair market value that is determined by local assessors to be the total taxable value of land and additions on the property. | Land | Improvement |
|---|---|---|---|---|
| 2024 | $6,743 | $29,200 | $7,000 | $22,200 |
| 2023 | $6,743 | $29,200 | $7,000 | $22,200 |
| 2022 | $6,597 | $29,200 | $7,000 | $22,200 |
| 2021 | $6,677 | $29,200 | $7,000 | $22,200 |
| 2020 | $6,499 | $29,200 | $7,000 | $22,200 |
| 2019 | $5,745 | $29,200 | $7,000 | $22,200 |
| 2018 | $5,745 | $29,200 | $7,000 | $22,200 |
| 2017 | $5,417 | $29,200 | $7,000 | $22,200 |
| 2016 | $5,315 | $29,200 | $7,000 | $22,200 |
| 2015 | -- | $29,200 | $7,000 | $22,200 |
| 2014 | -- | $29,200 | $7,000 | $22,200 |
Source: Public Records
Map
Nearby Homes
- 23 Marian Ct
- 99 Evan Rd
- 0 Wickham Dr Unit KEY969566
- 58 Darin Rd
- 16 Knights Ln
- 124 E Ridge Rd
- 1367 Kings Hwy
- 225 Kings Hwy
- 307 Gibson Hill Rd
- 1414 Kings Hwy
- 6 Belcher Rd
- 4 Well Sweep Ln
- 55 Beverly Rd
- 487 Black Meadow Rd
- 552 Pine Hill Rd
- 25 Sugarloaf Mountain Rd
- 8 Wisner Trail
- 4 Debbie Ct
- 53 Odyssey Dr
- 58 Strang Ln
Your Personal Tour Guide
Ask me questions while you tour the home.