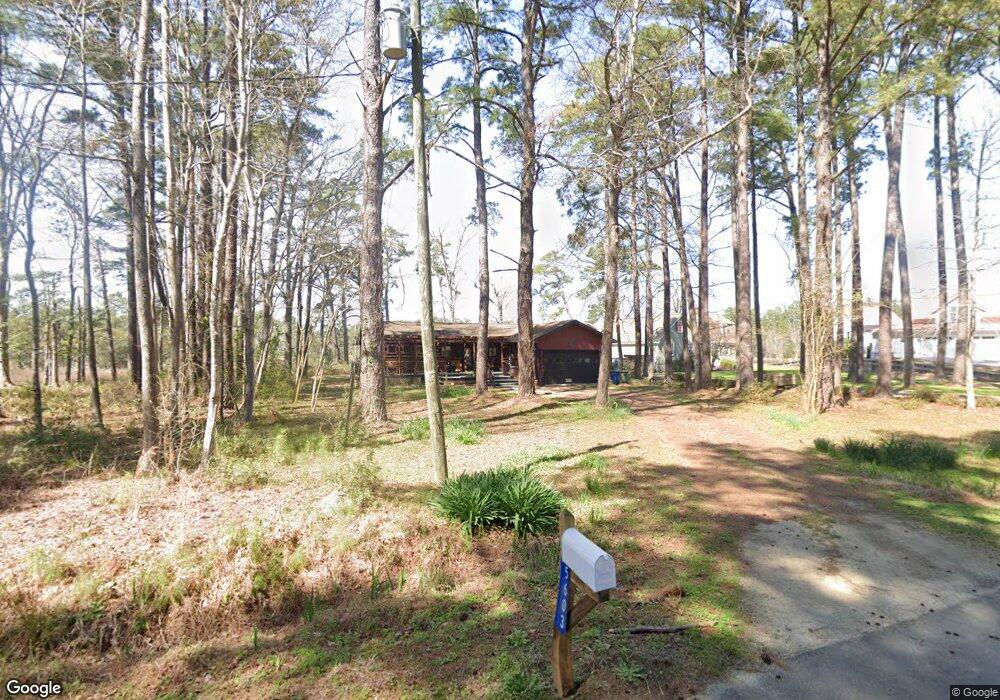
5603 Styron Dr Oriental, NC 28571
Estimated Value: $409,000 - $484,000
2
Beds
2
Baths
1,825
Sq Ft
$240/Sq Ft
Est. Value
About This Home
This home is located at 5603 Styron Dr, Oriental, NC 28571 and is currently estimated at $437,161, approximately $239 per square foot. 5603 Styron Dr is a home located in Pamlico County with nearby schools including Pamlico County Primary School, Fred A. Anderson Elementary School, and Pamlico County Middle School.
Ownership History
Date
Name
Owned For
Owner Type
Purchase Details
Closed on
May 8, 2025
Sold by
Hanby Siren Anne
Bought by
Hanby Siren Anne and Siren Edward D
Current Estimated Value
Purchase Details
Closed on
Nov 14, 2019
Sold by
Siren Edward D
Bought by
Siren Anne H
Purchase Details
Closed on
Jun 1, 2018
Sold by
Edward D Siren Jr Ret
Bought by
Siren Edward D
Purchase Details
Closed on
Jan 24, 2014
Sold by
Siren Edward D
Bought by
Siren Edward D and Edward D Siren Jr Revocable Tr
Purchase Details
Closed on
Dec 11, 2007
Sold by
Neil Robert Jo Son and Bell Frances C
Bought by
Siren Edward D
Home Financials for this Owner
Home Financials are based on the most recent Mortgage that was taken out on this home.
Original Mortgage
$32,000
Interest Rate
6.22%
Mortgage Type
Purchase Money Mortgage
Purchase Details
Closed on
Aug 4, 2004
Bought by
Bell Robert Jo'Son Neil
Purchase Details
Closed on
Aug 2, 1996
Create a Home Valuation Report for This Property
The Home Valuation Report is an in-depth analysis detailing your home's value as well as a comparison with similar homes in the area
Home Values in the Area
Average Home Value in this Area
Purchase History
| Date | Buyer | Sale Price | Title Company |
|---|---|---|---|
| Hanby Siren Anne | $2,500 | None Listed On Document | |
| Hanby Siren Anne | -- | None Listed On Document | |
| Hanby Siren Anne | -- | None Listed On Document | |
| Siren Anne H | -- | -- | |
| Siren Edward D | -- | -- | |
| Siren Edward D | -- | None Available | |
| Siren Edward D | $320,000 | None Available | |
| Bell Robert Jo'Son Neil | $320,000 | -- | |
| -- | $320,000 | -- |
Source: Public Records
Mortgage History
| Date | Status | Borrower | Loan Amount |
|---|---|---|---|
| Previous Owner | Siren Edward D | $32,000 |
Source: Public Records
Tax History
| Year | Tax Paid | Tax Assessment Tax Assessment Total Assessment is a certain percentage of the fair market value that is determined by local assessors to be the total taxable value of land and additions on the property. | Land | Improvement |
|---|---|---|---|---|
| 2025 | $2,079 | $232,341 | $91,811 | $140,530 |
| 2024 | $2,079 | $232,341 | $91,811 | $140,530 |
| 2023 | $2,033 | $232,341 | $91,811 | $140,530 |
| 2022 | $2,033 | $232,341 | $91,811 | $140,530 |
| 2021 | $2,033 | $232,341 | $91,811 | $140,530 |
| 2020 | $2,033 | $232,341 | $91,811 | $140,530 |
| 2019 | $2,043 | $233,452 | $90,000 | $143,452 |
| 2018 | $2,043 | $0 | $0 | $0 |
| 2017 | $2,043 | $0 | $0 | $0 |
| 2016 | $2,027 | $0 | $0 | $0 |
| 2015 | $1,980 | $233,452 | $90,000 | $143,452 |
| 2014 | $1,980 | $233,452 | $90,000 | $143,452 |
Source: Public Records
Map
Nearby Homes
- 0 Harbour Way Unit 100537440
- 5996 Harbour Way
- 5310 Anchor Way
- 5301 Anchor Way
- 28 Madison
- 29 Madison
- 48 Madison
- 5303 Anchor
- 6020 Harbour Way Unit A4
- 6020 Harbour Way Unit Slip 33
- 66 Madison
- 1750 White Farm Rd
- 0 White Farm Rd
- 0 White Farm Rd Unit 100543715
- 615 Bent Tree Rd
- 1890 White Farm Rd Unit 15
- 5522 Sandpiper Dr
- 5529 Sandpiper Dr
- 6000 Dolphin Rd
- 6054 Dolphin Rd
Your Personal Tour Guide
Ask me questions while you tour the home.