Estimated Value: $470,000 - $644,000
5
Beds
4
Baths
3,074
Sq Ft
$179/Sq Ft
Est. Value
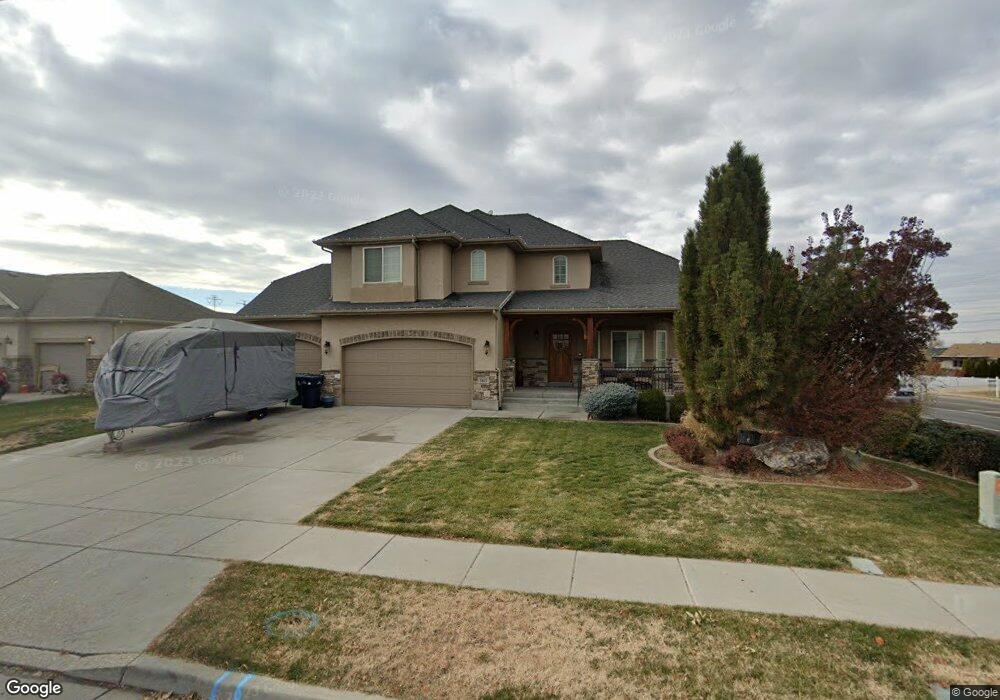
About This Home
This home is located at 5611 S 3100 W, Roy, UT 84067 and is currently estimated at $549,667, approximately $178 per square foot. 5611 S 3100 W is a home located in Weber County with nearby schools including Roy Elementary School, Roy Junior High School, and Roy High School.
Ownership History
Date
Name
Owned For
Owner Type
Purchase Details
Closed on
Jan 30, 2023
Sold by
Yannetta Christopher and Yannetta Sarah
Bought by
Utah Department Of Transportation
Current Estimated Value
Purchase Details
Closed on
Jun 9, 2016
Sold by
Yanetta Christopher
Bought by
Yannetta Christopher and Yannetta Sarah
Home Financials for this Owner
Home Financials are based on the most recent Mortgage that was taken out on this home.
Original Mortgage
$299,730
Interest Rate
3.66%
Mortgage Type
New Conventional
Purchase Details
Closed on
Apr 26, 2013
Sold by
Ivory Homes Ltd
Bought by
George Joel A
Home Financials for this Owner
Home Financials are based on the most recent Mortgage that was taken out on this home.
Original Mortgage
$334,000
Interest Rate
3.6%
Mortgage Type
VA
Purchase Details
Closed on
Aug 22, 2008
Sold by
Solgarden Llc
Bought by
Ivory Homes Ltd
Purchase Details
Closed on
Aug 1, 2007
Sold by
Ivory Development Llc
Bought by
Solgarden Llc
Create a Home Valuation Report for This Property
The Home Valuation Report is an in-depth analysis detailing your home's value as well as a comparison with similar homes in the area
Home Values in the Area
Average Home Value in this Area
Purchase History
| Date | Buyer | Sale Price | Title Company |
|---|---|---|---|
| Utah Department Of Transportation | -- | Inwest Title | |
| Yannetta Christopher | -- | Hickman Land Title Co | |
| Yannetts Christopher | -- | Select Title Ins Agency | |
| George Joel A | -- | Cottonwood Title Insurance A | |
| Ivory Homes Ltd | -- | Cottonwood Title Insurance A | |
| Solgarden Llc | -- | Accommodation |
Source: Public Records
Mortgage History
| Date | Status | Borrower | Loan Amount |
|---|---|---|---|
| Previous Owner | Yannetta Christopher | $299,730 | |
| Previous Owner | George Joel A | $334,000 |
Source: Public Records
Tax History
| Year | Tax Paid | Tax Assessment Tax Assessment Total Assessment is a certain percentage of the fair market value that is determined by local assessors to be the total taxable value of land and additions on the property. | Land | Improvement |
|---|---|---|---|---|
| 2025 | $272 | $170,000 | $170,000 | $0 |
| 2024 | $265 | $170,253 | $170,253 | $0 |
| 2023 | $534 | $617,815 | $164,901 | $452,914 |
| 2022 | $3,501 | $325,600 | $74,255 | $251,345 |
| 2021 | $3,087 | $475,000 | $90,005 | $384,995 |
| 2020 | $2,726 | $383,000 | $90,005 | $292,995 |
| 2019 | $2,797 | $372,000 | $12,535 | $359,465 |
| 2018 | $2,673 | $335,000 | $55,082 | $279,918 |
| 2017 | $2,762 | $327,000 | $55,082 | $271,918 |
| 2016 | $2,539 | $161,212 | $30,199 | $131,013 |
| 2015 | $2,308 | $150,061 | $32,852 | $117,209 |
| 2014 | $186 | $150,061 | $27,427 | $122,634 |
Source: Public Records
Map
Nearby Homes
Your Personal Tour Guide
Ask me questions while you tour the home.