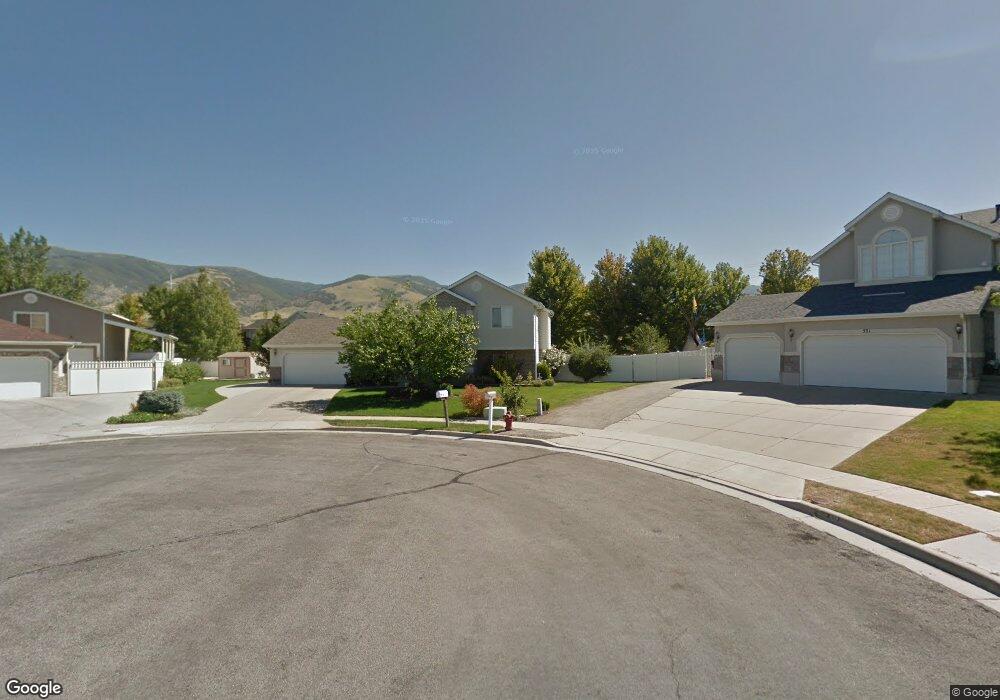
562 W 1225 N West Bountiful, UT 84087
Estimated Value: $519,225 - $572,000
3
Beds
2
Baths
1,652
Sq Ft
$328/Sq Ft
Est. Value
About This Home
This home is located at 562 W 1225 N, West Bountiful, UT 84087 and is currently estimated at $541,056, approximately $327 per square foot. 562 W 1225 N is a home located in Davis County with nearby schools including West Bountiful Elementary School, Bountiful Junior High School, and Viewmont High School.
Ownership History
Date
Name
Owned For
Owner Type
Purchase Details
Closed on
Jun 14, 2017
Sold by
Halloway Polly A and Nagao Pamela
Bought by
Halloway Living Trust and Polly A Halloway
Current Estimated Value
Purchase Details
Closed on
Jun 29, 1999
Sold by
Gmw Development Inc
Bought by
Nagao Pamela and Halloway Polly A
Home Financials for this Owner
Home Financials are based on the most recent Mortgage that was taken out on this home.
Original Mortgage
$163,200
Interest Rate
7.05%
Create a Home Valuation Report for This Property
The Home Valuation Report is an in-depth analysis detailing your home's value as well as a comparison with similar homes in the area
Home Values in the Area
Average Home Value in this Area
Purchase History
| Date | Buyer | Sale Price | Title Company |
|---|---|---|---|
| Halloway Living Trust | -- | -- | |
| Nagao Pamela | -- | Bonneville Title Company Inc |
Source: Public Records
Mortgage History
| Date | Status | Borrower | Loan Amount |
|---|---|---|---|
| Previous Owner | Nagao Pamela | $163,200 |
Source: Public Records
Tax History
| Year | Tax Paid | Tax Assessment Tax Assessment Total Assessment is a certain percentage of the fair market value that is determined by local assessors to be the total taxable value of land and additions on the property. | Land | Improvement |
|---|---|---|---|---|
| 2025 | $2,999 | $257,950 | $148,837 | $109,113 |
| 2024 | $2,818 | $248,050 | $122,444 | $125,606 |
| 2023 | $2,695 | $435,000 | $231,262 | $203,738 |
| 2022 | $2,759 | $249,700 | $111,222 | $138,478 |
| 2021 | $2,476 | $343,000 | $150,588 | $192,412 |
| 2020 | $2,188 | $299,000 | $139,293 | $159,707 |
| 2019 | $2,115 | $286,000 | $140,202 | $145,798 |
| 2018 | $1,982 | $263,000 | $139,877 | $123,123 |
| 2016 | $1,715 | $123,860 | $37,159 | $86,701 |
| 2015 | $1,686 | $115,665 | $37,159 | $78,506 |
| 2014 | $1,474 | $103,310 | $37,159 | $66,151 |
| 2013 | -- | $111,127 | $43,787 | $67,340 |
Source: Public Records
Map
Nearby Homes
- 1520 N 550 W
- 1449 N 725 W
- 1503 N 300 W
- 845 N 275 W
- 1625 Pages Place
- 1130 N 200 W
- 553 N 200 W
- 403 W 400 N Unit 1
- 499 N 200 W Unit 18
- 499 N 200 W Unit 19
- 290 N 500 W Unit 108
- 290 N 500 W Unit 305
- 3166 Linden Cir
- 332 N 300 W
- 18 W Lady Ln
- 18 W 900 N
- 449 W 200 N Unit 3
- 1115 N Main St
- 1695 N Olsen Way Unit 802
- 182 W 300 N Unit 4
Your Personal Tour Guide
Ask me questions while you tour the home.