Estimated Value: $231,800 - $316,000
Studio
2
Baths
1,632
Sq Ft
$166/Sq Ft
Est. Value
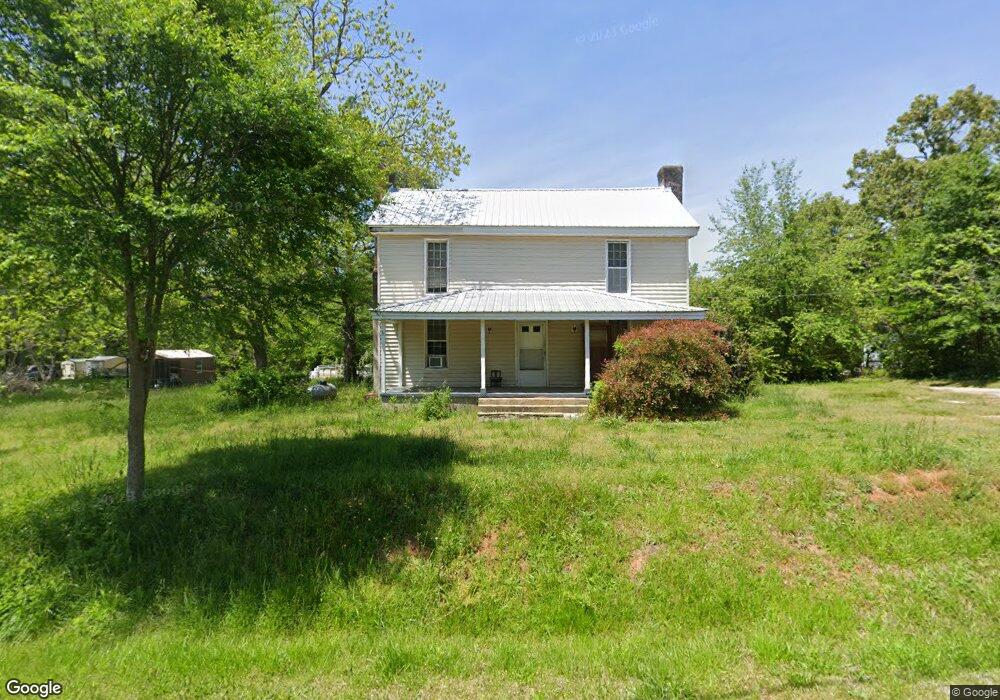
About This Home
This home is located at 564 James Holcomb Rd, Hull, GA 30646 and is currently estimated at $270,700, approximately $165 per square foot. 564 James Holcomb Rd is a home located in Madison County with nearby schools including Madison County High School.
Ownership History
Date
Name
Owned For
Owner Type
Purchase Details
Closed on
Jan 27, 2016
Sold by
Price Trevor Jason
Bought by
Price Helen R and Allen Felisha M
Current Estimated Value
Purchase Details
Closed on
Jun 23, 2014
Sold by
Mobley Brooke Ridgeway
Bought by
Eisenberg Barbara P
Purchase Details
Closed on
Apr 15, 2011
Sold by
Meadow Sarah Irene
Bought by
Meadow Sarah Irene and Bray Angie Pauline
Purchase Details
Closed on
Jan 1, 1982
Bought by
Holcomb Norene F
Create a Home Valuation Report for This Property
The Home Valuation Report is an in-depth analysis detailing your home's value as well as a comparison with similar homes in the area
Purchase History
| Date | Buyer | Sale Price | Title Company |
|---|---|---|---|
| Price Helen R | -- | -- | |
| Eisenberg Barbara P | -- | -- | |
| Meadow Sarah Irene | -- | -- | |
| Holcomb Norene F | -- | -- |
Source: Public Records
Tax History
| Year | Tax Paid | Tax Assessment Tax Assessment Total Assessment is a certain percentage of the fair market value that is determined by local assessors to be the total taxable value of land and additions on the property. | Land | Improvement |
|---|---|---|---|---|
| 2025 | $1,472 | $57,937 | $16,869 | $41,068 |
| 2024 | $1,474 | $56,647 | $16,869 | $39,778 |
| 2023 | $1,334 | $51,238 | $14,057 | $37,181 |
| 2022 | $1,172 | $42,493 | $9,664 | $32,829 |
| 2021 | $1,043 | $34,151 | $9,664 | $24,487 |
| 2020 | $1,007 | $32,745 | $8,258 | $24,487 |
| 2019 | $1,002 | $32,229 | $8,258 | $23,971 |
| 2018 | $957 | $30,691 | $7,555 | $23,136 |
| 2017 | $867 | $30,127 | $7,029 | $23,098 |
| 2016 | $741 | $25,818 | $6,393 | $19,426 |
| 2015 | $741 | $25,818 | $6,393 | $19,426 |
| 2014 | $742 | $25,674 | $6,393 | $19,282 |
| 2013 | -- | $25,674 | $6,393 | $19,282 |
Source: Public Records
Map
Nearby Homes
- 232 Glenn Carrie Rd Unit 1
- 240 Glenn Carrie Rd Unit 2
- 19 Glenn Carrie Rd
- 489 Childers Rd
- 487 Childers Rd
- 26 Isabelles Way
- 226 Hidden Falls Dr
- 1361 Hull Rd
- 2202 Lem Edwards Rd
- 142 Rolling Woods Ln Unit 29
- 142 Rolling Woods Ln
- 151 Rolling Woods Ln
- 31 Rolling Woods Ln
- 194 Woodland Creek Place
- 1080 Spratlin Mill Dr
- 136 Hidden Lake Dr
- 1330 McCannon-morris Rd
- 105 Hidden Lake Ct
- 3013 Lawton Ln
- 741 Harve Mathis Rd
- 446 James Holcomb Rd
- Tract 7 James Holcomb Rd
- tract 4 James Holcomb Rd
- TR 1,2,3 James Holcomb Rd
- 755 James Holcomb Rd
- 361 James Holcomb Rd
- 365 James Holcomb Rd
- 367 James Holcomb Rd
- 367 James Holcomb Rd Unit Tract D
- 365 James Holcomb Rd Unit Tract C
- 361 James Holcomb Rd Unit Tract A
- 624 James Holcomb Rd
- 396 James Holcomb Rd
- 0 James Holcomb Rd Unit 10121944
- 0 James Holcomb Rd Unit 1004098
- 0 Paul Smith Rd Unit 3177846
- 0 Paul Smith Rd Unit 7503533
- 0 Paul Smith Rd Unit 7518932
- 0 Paul Smith Rd Unit 7613436
- 0 Paul Smith Rd Unit 8112956
Your Personal Tour Guide
Ask me questions while you tour the home.