569 Fuller St Ludlow, MA 01056
Estimated Value: $400,592 - $477,000
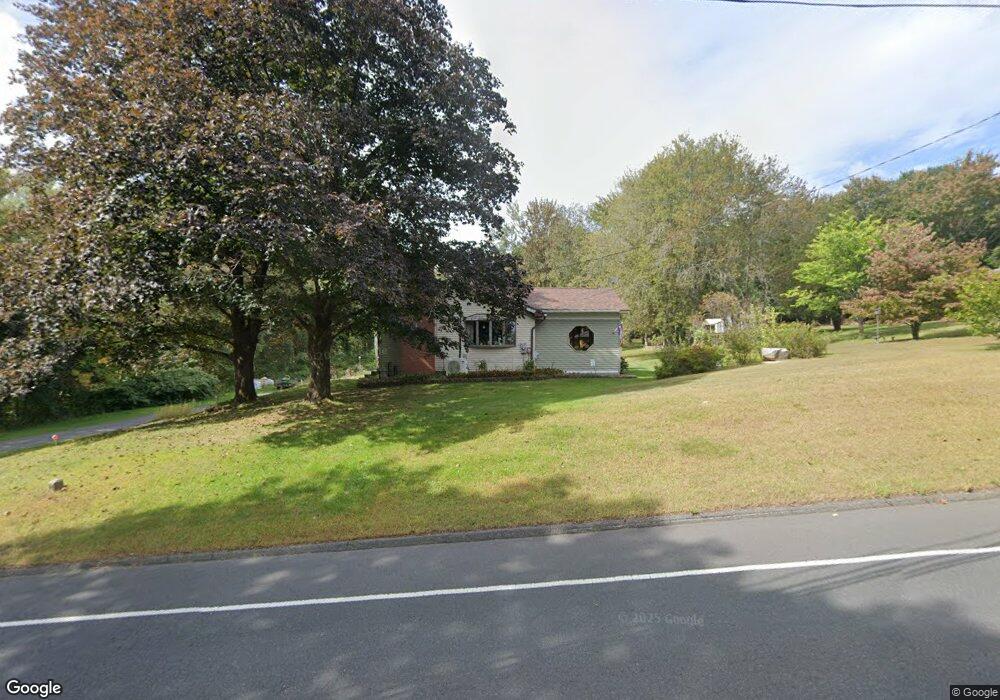
About This Home
This home is located at 569 Fuller St, Ludlow, MA 01056 and is currently estimated at $437,898, approximately $272 per square foot. 569 Fuller St is a home located in Hampden County with nearby schools including East Street Elementary School, Chapin Street Elementary School, and Paul R. Baird Middle School.
Ownership History
We collect this data history from publicly available records. To have your information removed, we recommend requesting removal directly through your county’s website.
Purchase Details
Home Financials for this Owner
Home Financials are based on the most recent Mortgage that was taken out on this home.Purchase Details
Home Financials for this Owner
Home Financials are based on the most recent Mortgage that was taken out on this home.Home Values in the Area
Average Home Value in this Area
Purchase History
We collect this data history from publicly available records. To have your information removed, we recommend requesting removal directly through your county’s website.
| Date | Buyer | Sale Price | Title Company |
|---|---|---|---|
| -- | None Available | ||
| -- | None Available | ||
| -- | -- | ||
| -- | -- |
Mortgage History
We collect this data history from publicly available records. To have your information removed, we recommend requesting removal directly through your county’s website.
| Date | Status | Borrower | Loan Amount |
|---|---|---|---|
| Open | $199,200 | ||
| Previous Owner | $209,612 | ||
| Previous Owner | $116,130 |
Tax History
We collect this data history from publicly available records. To have your information removed, we recommend requesting removal directly through your county’s website.
| Year | Tax Paid | Tax Assessment Tax Assessment Total Assessment is a certain percentage of the fair market value that is determined by local assessors to be the total taxable value of land and additions on the property. | Land | Improvement |
|---|---|---|---|---|
| 2025 | $6,142 | $354,000 | $109,400 | $244,600 |
| 2024 | $5,892 | $325,700 | $109,500 | $216,200 |
| 2023 | $5,629 | $288,500 | $96,000 | $192,500 |
| 2022 | $5,447 | $272,500 | $96,000 | $176,500 |
| 2021 | $5,534 | $262,500 | $96,000 | $166,500 |
| 2020 | $5,314 | $257,700 | $94,500 | $163,200 |
| 2019 | $5,030 | $253,800 | $93,700 | $160,100 |
| 2018 | $4,766 | $250,700 | $93,700 | $157,000 |
| 2017 | $4,658 | $251,400 | $91,800 | $159,600 |
| 2016 | $4,329 | $238,800 | $84,900 | $153,900 |
| 2015 | $4,098 | $237,000 | $84,100 | $152,900 |
Map
- 353 Fuller St Unit 4
- 15 Leland Dr
- lot 14 West St
- 57 Valley View Dr
- 113 Skyridge St
- 36 Homestretch Dr
- Lot 9 Old St W
- Lot 6 Old St W
- Lot 7 Old St W
- 152 Kendall St
- 482 Holyoke St
- 75 Bridle Rd
- 925 West St
- 24 Helena St
- 227 East St
- 72 Chapin Greene Dr
- 128 Swan Ave
- 84 Chapin Greene Dr
- 79 Chapin Greene Dr
- 517 Ideal Ln Unit 603
Ask me questions while you tour the home.