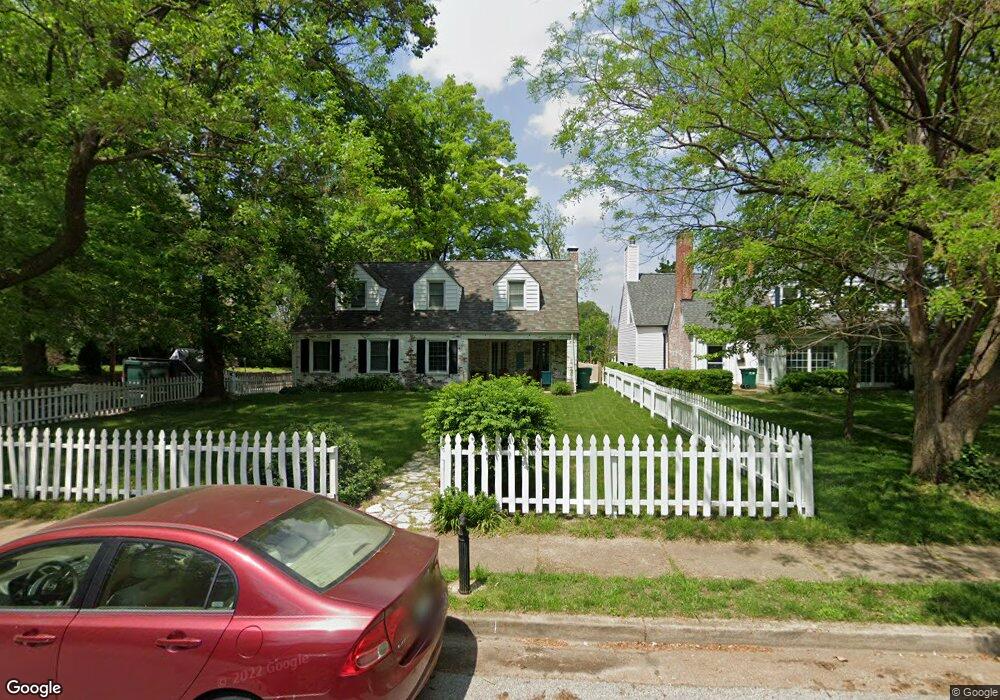
569 Olive Ct Saint Louis, MO 63119
Estimated Value: $709,588 - $1,183,000
About This Home
This home is located at 569 Olive Ct, Saint Louis, MO 63119 and is currently estimated at $844,897, approximately $298 per square foot. 569 Olive Ct is a home located in St. Louis County with nearby schools including Clark Elementary School, Hixson Middle School, and Webster Groves High School.
Ownership History
We collect this data history from publicly available records. To have your information removed, we recommend requesting removal directly through your county’s website.
Purchase Details
Home Financials for this Owner
Home Financials are based on the most recent Mortgage that was taken out on this home.Home Values in the Area
Average Home Value in this Area
Purchase History
We collect this data history from publicly available records. To have your information removed, we recommend requesting removal directly through your county’s website.
| Date | Buyer | Sale Price | Title Company |
|---|---|---|---|
| $277,250 | -- |
Mortgage History
We collect this data history from publicly available records. To have your information removed, we recommend requesting removal directly through your county’s website.
| Date | Status | Borrower | Loan Amount |
|---|---|---|---|
| Open | $221,800 |
Tax History
We collect this data history from publicly available records. To have your information removed, we recommend requesting removal directly through your county’s website.
| Year | Tax Paid | Tax Assessment Tax Assessment Total Assessment is a certain percentage of the fair market value that is determined by local assessors to be the total taxable value of land and additions on the property. | Land | Improvement |
|---|---|---|---|---|
| 2025 | $7,073 | $118,540 | $70,110 | $48,430 |
| 2024 | $7,073 | $101,890 | $48,200 | $53,690 |
| 2023 | $7,039 | $101,890 | $48,200 | $53,690 |
| 2022 | $5,693 | $76,410 | $39,440 | $36,970 |
| 2021 | $5,673 | $76,410 | $39,440 | $36,970 |
| 2020 | $6,767 | $85,030 | $35,060 | $49,970 |
| 2019 | $6,719 | $85,030 | $35,060 | $49,970 |
| 2018 | $6,654 | $74,790 | $35,060 | $39,730 |
| 2017 | $6,609 | $74,790 | $35,060 | $39,730 |
| 2016 | $5,334 | $57,670 | $31,560 | $26,110 |
| 2015 | $5,360 | $57,670 | $31,560 | $26,110 |
| 2014 | $7,077 | $74,190 | $18,390 | $55,800 |
Map
- 550 Locust Ct
- 638 Sherwood Dr
- 465 Sherwood Dr
- 513 Hollywood Place
- 444 Sherwood Dr
- 457 Yorkshire Place
- 710 S Rock Hill Rd
- 634 Yeddo Ave
- 423 Maelln Dr
- 304 Papin Ave
- 445 Algonquin Place
- 1345 Green Tree Ln
- 217 Elm Ave
- 8 Banbury Ct
- 505 Cherry Ave
- 928 S Gore Ave
- 250 Turf Ct
- 439 Fieldcrest Dr
- 1018 Ferndale Ave
- 9715 Big Bend Blvd
- 563 Olive Ct
- 623 Crofton Ave
- 559 Olive Ct
- 549 Olive Ct
- 629 Crofton Ave
- 568 Olive Ct
- 604 Crofton Ave
- 562 Olive Ct
- 558 Olive Ct
- 637 Crofton Ave
- 543 Olive Ct
- 554 Sheffield Ave
- 554 Olive Ct
- 614 Hollywood Place
- 618 Hollywood Place
- 606 Hollywood Place
- 550 Olive Ct
- 645 Crofton Ave
- 622 Hollywood Place
- 546 Sheffield Ave
Ask me questions while you tour the home.