569 Pond St Woonsocket, RI 02895
Social District NeighborhoodEstimated Value: $345,000 - $352,000
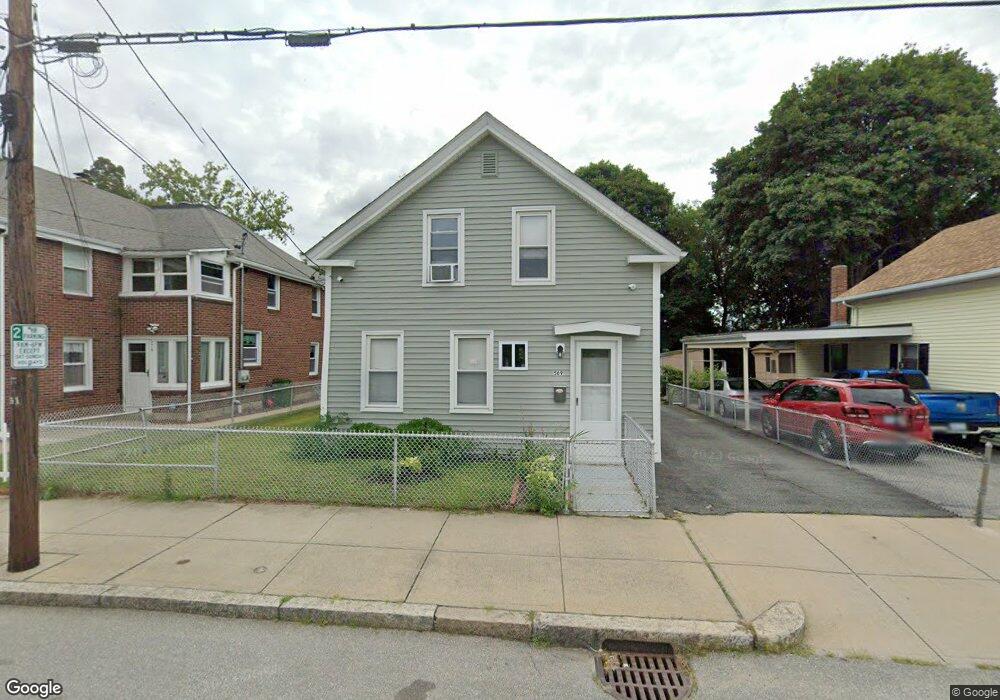
About This Home
This home is located at 569 Pond St, Woonsocket, RI 02895 and is currently estimated at $347,807, approximately $286 per square foot. 569 Pond St is a home located in Providence County with nearby schools including Woonsocket High School, Rise Prep Mayoral Academy Middle School, and Rise Prep Mayoral Academy.
Ownership History
We collect this data history from publicly available records. To have your information removed, we recommend requesting removal directly through your county’s website.
Purchase Details
Home Financials for this Owner
Home Financials are based on the most recent Mortgage that was taken out on this home.Purchase Details
Home Values in the Area
Average Home Value in this Area
Purchase History
We collect this data history from publicly available records. To have your information removed, we recommend requesting removal directly through your county’s website.
| Date | Buyer | Sale Price | Title Company |
|---|---|---|---|
| $161,500 | -- | ||
| $161,500 | -- | ||
| $61,500 | -- |
Mortgage History
We collect this data history from publicly available records. To have your information removed, we recommend requesting removal directly through your county’s website.
| Date | Status | Borrower | Loan Amount |
|---|---|---|---|
| Open | $111,020 | ||
| Closed | $129,200 | ||
| Closed | $24,225 |
Tax History
We collect this data history from publicly available records. To have your information removed, we recommend requesting removal directly through your county’s website.
| Year | Tax Paid | Tax Assessment Tax Assessment Total Assessment is a certain percentage of the fair market value that is determined by local assessors to be the total taxable value of land and additions on the property. | Land | Improvement |
|---|---|---|---|---|
| 2025 | $3,425 | $305,000 | $89,400 | $215,600 |
| 2024 | $3,331 | $229,100 | $91,000 | $138,100 |
| 2023 | $3,203 | $229,100 | $91,000 | $138,100 |
| 2022 | $3,203 | $229,100 | $91,000 | $138,100 |
| 2021 | $2,803 | $118,000 | $37,100 | $80,900 |
| 2020 | $2,832 | $118,000 | $37,100 | $80,900 |
| 2018 | $2,841 | $118,000 | $37,100 | $80,900 |
| 2017 | $3,284 | $109,100 | $40,600 | $68,500 |
| 2016 | $3,474 | $109,100 | $40,600 | $68,500 |
| 2015 | $3,991 | $109,100 | $40,600 | $68,500 |
| 2014 | $3,806 | $105,900 | $44,700 | $61,200 |
Map
- 481 N Main St
- 130 E School St
- 283 Privilege St Unit 4
- 159 Earle St
- 32 Vine St
- 495 Gaskill St
- 185 Spring St
- 0 Diamond Hill Rd Unit 1406968
- 187 Boyden St
- 15 Lewis St
- 144 Woodland Rd
- 414 Rathbun St Unit 5
- 414 Rathbun St
- 70 Woodland Rd
- 227 Rathbun St
- 420 Rathbun St Unit 9
- 420 Rathbun St
- 736 Social St Unit 1R
- 736 Social St Unit 2R
- 752 Social St
Ask me questions while you tour the home.