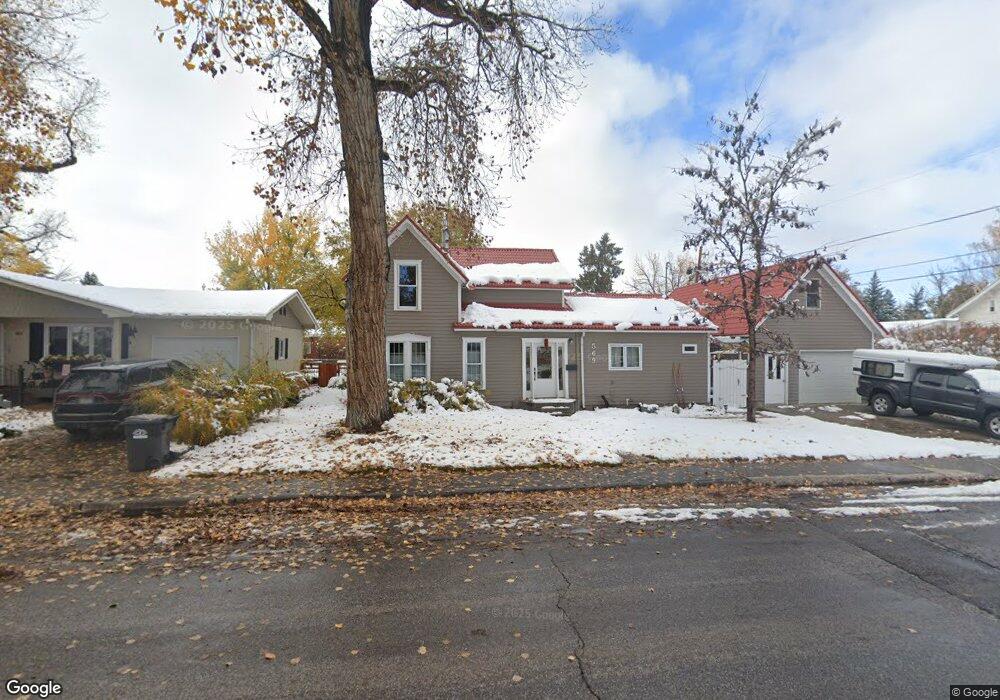
569 S 3rd St Lander, WY 82520
Estimated Value: $372,810 - $445,000
3
Beds
2
Baths
1,368
Sq Ft
$300/Sq Ft
Est. Value
About This Home
This home is located at 569 S 3rd St, Lander, WY 82520 and is currently estimated at $410,953, approximately $300 per square foot. 569 S 3rd St is a home located in Fremont County with nearby schools including Lander Valley High School and Lander Christian Academy.
Ownership History
Date
Name
Owned For
Owner Type
Purchase Details
Closed on
Oct 6, 2009
Sold by
Agnew Christopher C and Mccluskey Lara K
Bought by
Agnew Christopher C
Current Estimated Value
Purchase Details
Closed on
Apr 6, 2007
Sold by
Thomas Valerie Hafner and Thomas Stephen D
Bought by
Agnew Christopher C and Mccluskey Lara K
Home Financials for this Owner
Home Financials are based on the most recent Mortgage that was taken out on this home.
Original Mortgage
$179,600
Interest Rate
6.24%
Mortgage Type
New Conventional
Create a Home Valuation Report for This Property
The Home Valuation Report is an in-depth analysis detailing your home's value as well as a comparison with similar homes in the area
Home Values in the Area
Average Home Value in this Area
Purchase History
| Date | Buyer | Sale Price | Title Company |
|---|---|---|---|
| Agnew Christopher C | -- | Fremount County Title | |
| Agnew Christopher C | -- | None Available |
Source: Public Records
Mortgage History
| Date | Status | Borrower | Loan Amount |
|---|---|---|---|
| Previous Owner | Agnew Christopher C | $179,600 |
Source: Public Records
Tax History
| Year | Tax Paid | Tax Assessment Tax Assessment Total Assessment is a certain percentage of the fair market value that is determined by local assessors to be the total taxable value of land and additions on the property. | Land | Improvement |
|---|---|---|---|---|
| 2025 | $2,182 | $22,518 | $4,077 | $18,441 |
| 2024 | $2,182 | $28,274 | $5,436 | $22,838 |
| 2023 | $2,110 | $27,555 | $4,896 | $22,659 |
| 2022 | $1,785 | $23,822 | $4,896 | $18,926 |
| 2021 | $1,630 | $21,054 | $4,732 | $16,322 |
| 2020 | $1,576 | $20,404 | $4,732 | $15,672 |
| 2019 | $1,569 | $19,990 | $4,732 | $15,258 |
| 2018 | $1,537 | $19,370 | $4,732 | $14,638 |
| 2017 | $1,511 | $18,995 | $4,732 | $14,263 |
| 2016 | $1,503 | $18,920 | $4,732 | $14,188 |
| 2015 | $1,573 | $20,025 | $4,732 | $15,293 |
| 2014 | $1,364 | $17,390 | $4,732 | $12,658 |
Source: Public Records
Map
Nearby Homes
Your Personal Tour Guide
Ask me questions while you tour the home.