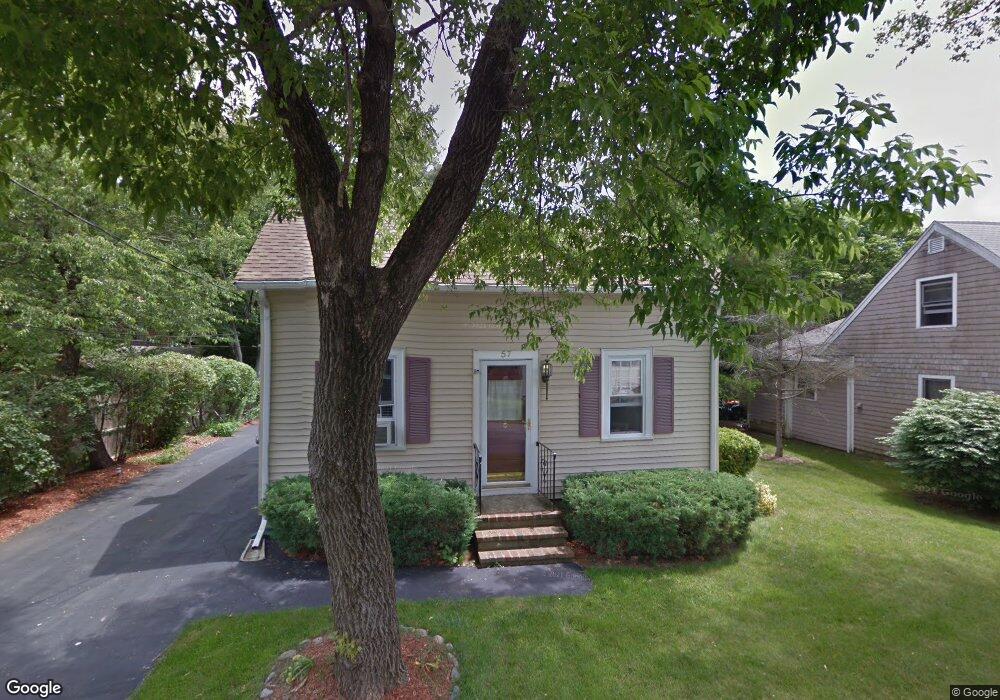
57 Archer Rd Rockland, MA 02370
Estimated Value: $467,000 - $534,000
Studio
1
Bath
1,020
Sq Ft
$485/Sq Ft
Est. Value
About This Home
This home is located at 57 Archer Rd, Rockland, MA 02370 and is currently estimated at $495,059, approximately $485 per square foot. 57 Archer Rd is a home located in Plymouth County with nearby schools including Rockland Senior High School, Calvary Chapel Academy, and Holy Family Elementary School.
Ownership History
Date
Name
Owned For
Owner Type
Purchase Details
Closed on
Oct 15, 1993
Sold by
Lundquist Thomas W
Bought by
Sinewick Gerald T
Current Estimated Value
Home Financials for this Owner
Home Financials are based on the most recent Mortgage that was taken out on this home.
Original Mortgage
$111,690
Interest Rate
6.87%
Mortgage Type
Purchase Money Mortgage
Create a Home Valuation Report for This Property
The Home Valuation Report is an in-depth analysis detailing your home's value as well as a comparison with similar homes in the area
Home Values in the Area
Average Home Value in this Area
Purchase History
We collect this data history from publicly available records. To have your information removed, we recommend requesting removal directly through your county’s website.
| Date | Buyer | Sale Price | Title Company |
|---|---|---|---|
| Sinewick Gerald T | $109,500 | -- |
Source: Public Records
Mortgage History
We collect this data history from publicly available records. To have your information removed, we recommend requesting removal directly through your county’s website.
| Date | Status | Borrower | Loan Amount |
|---|---|---|---|
| Closed | Sinewick Gerald T | $111,690 |
Source: Public Records
Tax History
| Year | Tax Paid | Tax Assessment Tax Assessment Total Assessment is a certain percentage of the fair market value that is determined by local assessors to be the total taxable value of land and additions on the property. | Land | Improvement |
|---|---|---|---|---|
| 2025 | $5,435 | $397,600 | $223,500 | $174,100 |
| 2024 | $5,277 | $375,300 | $210,800 | $164,500 |
| 2023 | $5,246 | $344,700 | $193,400 | $151,300 |
| 2022 | $5,030 | $300,300 | $168,100 | $132,200 |
| 2021 | $4,736 | $274,100 | $152,900 | $121,200 |
| 2020 | $4,179 | $261,400 | $145,600 | $115,800 |
| 2019 | $4,469 | $249,400 | $138,700 | $110,700 |
| 2018 | $4,253 | $233,400 | $138,700 | $94,700 |
| 2017 | $4,167 | $225,500 | $138,700 | $86,800 |
| 2016 | $4,014 | $217,100 | $133,400 | $83,700 |
| 2015 | $3,829 | $201,200 | $124,600 | $76,600 |
| 2014 | $3,461 | $188,700 | $122,200 | $66,500 |
Source: Public Records
Map
Nearby Homes
- 375 Webster St
- 17 Sunnybank Ave
- 92-94 Stanton St
- 491 Webster St
- 313 E Water St
- 142 Marks St
- 27 Stanton St
- 48 Bigelow Ave
- 196 Myrtle St
- 173 Liberty St
- 471 Union St
- 49 Custer St
- 107 E Water St
- 12 S Douglas St
- 15 Midfield Dr Unit 15
- 44 Vernon St
- 1 Canterbury Ln
- 6 Canterbury Ln
- 5 Crabapple Cir
- 9 Juniper Cir
Your Personal Tour Guide
Ask me questions while you tour the home.