57 Jackson St Pawtucket, RI 02860
Downtown Pawtucket NeighborhoodEstimated Value: $590,000 - $628,293
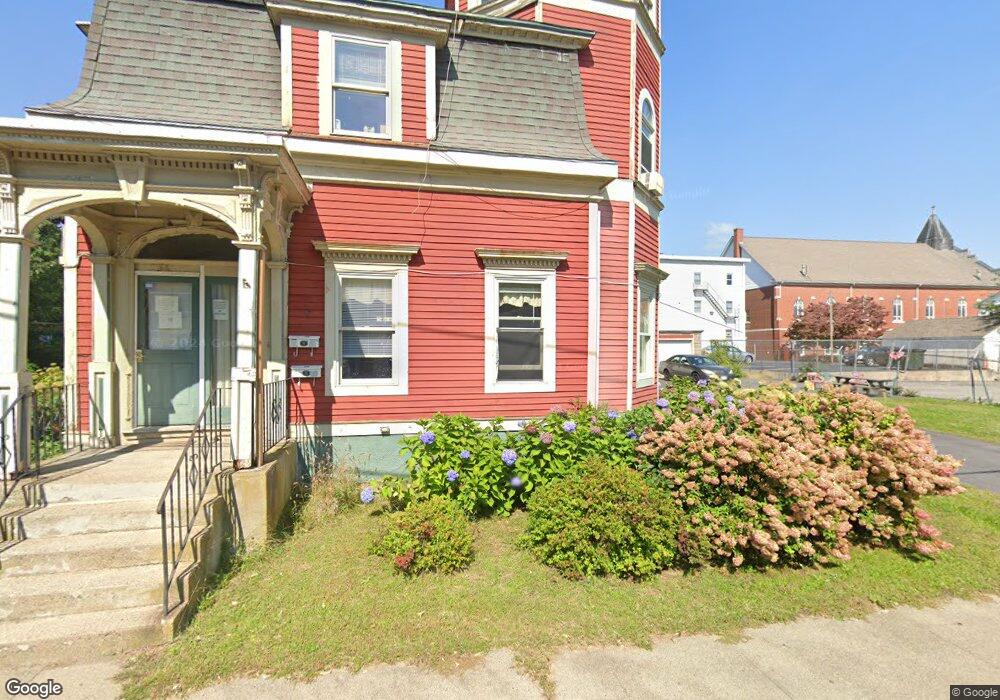
About This Home
This home is located at 57 Jackson St, Pawtucket, RI 02860 and is currently estimated at $607,823, approximately $210 per square foot. 57 Jackson St is a home located in Providence County with nearby schools including Central Falls Senior High School, International Charter School, and Blackstone Academy Charter School.
Ownership History
We collect this data history from publicly available records. To have your information removed, we recommend requesting removal directly through your county’s website.
Purchase Details
Purchase Details
Purchase Details
Home Values in the Area
Average Home Value in this Area
Purchase History
We collect this data history from publicly available records. To have your information removed, we recommend requesting removal directly through your county’s website.
| Date | Buyer | Sale Price | Title Company |
|---|---|---|---|
| -- | None Available | ||
| -- | -- | ||
| $60,000 | -- |
Mortgage History
We collect this data history from publicly available records. To have your information removed, we recommend requesting removal directly through your county’s website.
| Date | Status | Borrower | Loan Amount |
|---|---|---|---|
| Previous Owner | $12,000 | ||
| Previous Owner | $127,000 | ||
| Previous Owner | $30,000 | ||
| Previous Owner | $85,500 |
Tax History
We collect this data history from publicly available records. To have your information removed, we recommend requesting removal directly through your county’s website.
| Year | Tax Paid | Tax Assessment Tax Assessment Total Assessment is a certain percentage of the fair market value that is determined by local assessors to be the total taxable value of land and additions on the property. | Land | Improvement |
|---|---|---|---|---|
| 2025 | $6,391 | $486,000 | $91,200 | $394,800 |
| 2024 | $5,997 | $486,000 | $91,200 | $394,800 |
| 2023 | $5,607 | $331,000 | $39,800 | $291,200 |
| 2022 | $5,488 | $331,000 | $39,800 | $291,200 |
| 2021 | $5,488 | $331,000 | $39,800 | $291,200 |
| 2020 | $5,147 | $246,400 | $49,800 | $196,600 |
| 2019 | $5,147 | $246,400 | $49,800 | $196,600 |
| 2018 | $4,960 | $246,400 | $49,800 | $196,600 |
| 2017 | $4,655 | $204,900 | $44,100 | $160,800 |
| 2016 | $4,485 | $204,900 | $44,100 | $160,800 |
| 2015 | $4,485 | $204,900 | $44,100 | $160,800 |
| 2014 | $4,425 | $191,900 | $44,100 | $147,800 |
Map
- 78 Jenks St
- 404 Roosevelt Ave Unit 204G
- 511 High St
- 517 High St
- 112 Clay St
- 300 Front St Unit 105
- 300 Front St Unit 512
- 140 Dexter St
- 30 Foundry St Unit 5
- 2 King St
- 35 Rand St
- 28 Bayley St Unit 301
- 28 Bayley St Unit 107
- 28 Bayley St Unit 406
- 153 Central Ave
- 38 Lawrence St
- 139 Broadway
- 35 Allen Ave
- 50 Garfield St
- 36 Underwood St
- 28 Clay St Unit 6
- 28 Clay St Unit 5
- 28 Clay St
- 28 Clay St Unit 3
- 30 Clay St Unit 32
- 34 Clay St Unit 36
- 38 Clay St Unit 40
- 342 High St
- 171 Montgomery St
- 364 High St
- 323 High St Unit 329
- 313 High St
- 161 Montgomery St Unit 8
- 374 High St
- 46 Jackson St
- 42 Jackson St
- 315 High St
- 159 Montgomery St
- 52 Jackson St Unit 1
- 39 Clay St
Ask me questions while you tour the home.