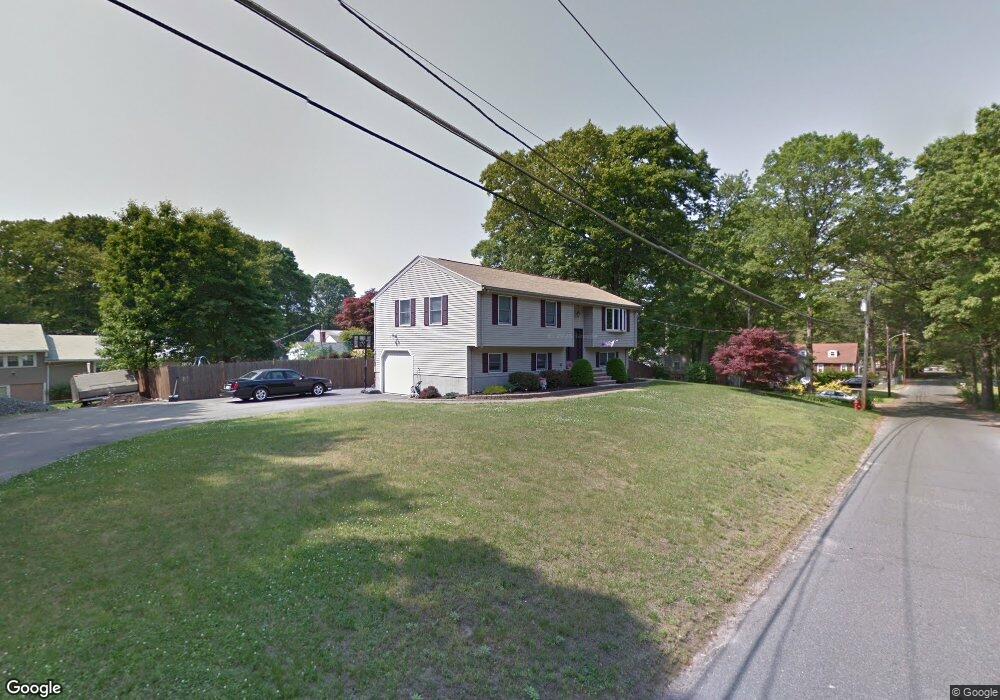
57 Juniper Rd Holbrook, MA 02343
Estimated Value: $565,000 - $665,000
About This Home
This home is located at 57 Juniper Rd, Holbrook, MA 02343 and is currently estimated at $626,834, approximately $292 per square foot. 57 Juniper Rd is a home located in Norfolk County with nearby schools including John F. Kennedy Elementary School, Holbrook Middle High School, and Boston Higashi School.
Ownership History
We collect this data history from publicly available records. To have your information removed, we recommend requesting removal directly through your county’s website.
Purchase Details
Home Values in the Area
Average Home Value in this Area
Purchase History
We collect this data history from publicly available records. To have your information removed, we recommend requesting removal directly through your county’s website.
| Date | Buyer | Sale Price | Title Company |
|---|---|---|---|
| $119,000 | -- | ||
| $119,000 | -- |
Mortgage History
We collect this data history from publicly available records. To have your information removed, we recommend requesting removal directly through your county’s website.
| Date | Status | Borrower | Loan Amount |
|---|---|---|---|
| Open | $25,000 | ||
| Open | $180,000 | ||
| Closed | $128,000 |
Tax History
We collect this data history from publicly available records. To have your information removed, we recommend requesting removal directly through your county’s website.
| Year | Tax Paid | Tax Assessment Tax Assessment Total Assessment is a certain percentage of the fair market value that is determined by local assessors to be the total taxable value of land and additions on the property. | Land | Improvement |
|---|---|---|---|---|
| 2025 | $71 | $536,100 | $227,100 | $309,000 |
| 2024 | $6,948 | $517,000 | $226,900 | $290,100 |
| 2023 | $7,373 | $479,400 | $206,400 | $273,000 |
| 2022 | $7,096 | $430,300 | $187,600 | $242,700 |
| 2021 | $6,881 | $399,600 | $170,200 | $229,400 |
| 2020 | $7,140 | $388,700 | $165,000 | $223,700 |
| 2019 | $7,015 | $360,500 | $154,400 | $206,100 |
| 2018 | $7,059 | $341,500 | $143,000 | $198,500 |
| 2017 | $6,663 | $318,800 | $129,800 | $189,000 |
| 2016 | $6,122 | $311,700 | $126,500 | $185,200 |
| 2015 | $5,699 | $298,700 | $121,000 | $177,700 |
| 2014 | $5,464 | $291,100 | $121,000 | $170,100 |
Map
- 456 South St
- 499 South St
- 36 Kalmia Rd
- 35 Hillsdale Rd
- 4 Ell Rd
- 27 Morgan Rd
- 610 S Franklin St Unit F101
- 14 Leonard Ln
- 484 S Franklin St
- 15 Jefferson Rd
- 627 S Franklin St
- 33 Quincy St
- 6 Sunnyside Ave
- 30 Roseen Rd
- 3 Rindone St
- 719 S Franklin St Unit B Block 3
- 719 S Franklin St Unit F Block 3
- 66 Frederickson Dr
- 150 E High St
- 39 Marion St
Ask me questions while you tour the home.