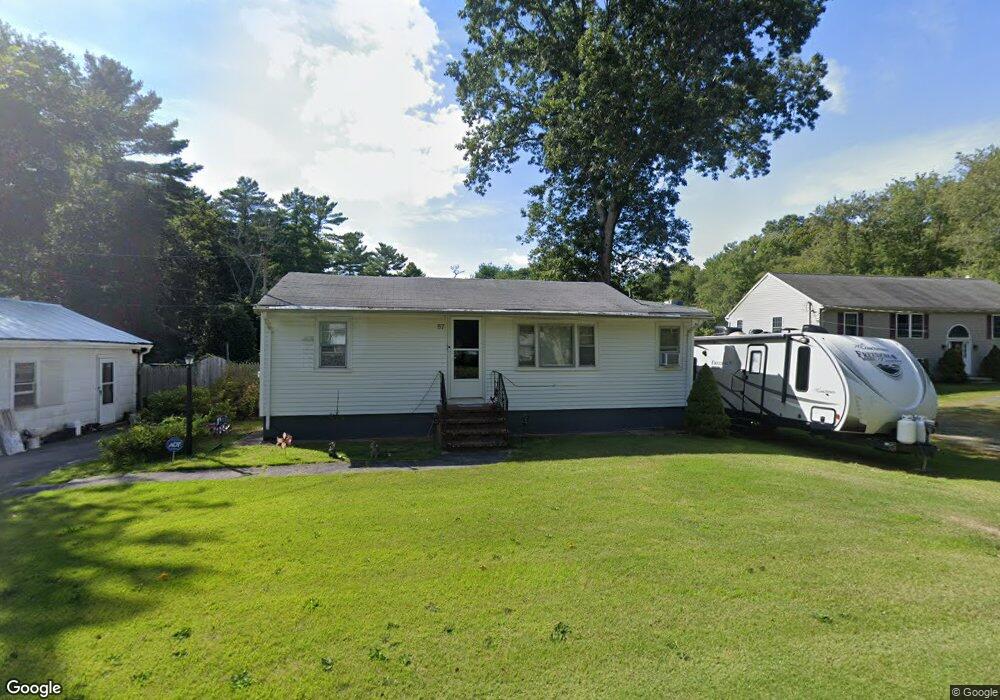
57 Locust St Berkley, MA 02779
Berkley Bridge/Lower Berkley NeighborhoodEstimated Value: $389,623 - $483,000
2
Beds
2
Baths
720
Sq Ft
$608/Sq Ft
Est. Value
About This Home
This home is located at 57 Locust St, Berkley, MA 02779 and is currently estimated at $437,906, approximately $608 per square foot. 57 Locust St is a home located in Bristol County with nearby schools including Berkley Community School and Our Lady of Lourdes School.
Ownership History
Date
Name
Owned For
Owner Type
Purchase Details
Closed on
Mar 1, 1994
Sold by
Medeiros Fernando and Medeiros Estrela C
Bought by
Pothier Timothy A and Pothier Sharon
Current Estimated Value
Home Financials for this Owner
Home Financials are based on the most recent Mortgage that was taken out on this home.
Original Mortgage
$111,050
Interest Rate
6.96%
Mortgage Type
Purchase Money Mortgage
Create a Home Valuation Report for This Property
The Home Valuation Report is an in-depth analysis detailing your home's value as well as a comparison with similar homes in the area
Home Values in the Area
Average Home Value in this Area
Purchase History
| Date | Buyer | Sale Price | Title Company |
|---|---|---|---|
| Pothier Timothy A | $116,900 | -- |
Source: Public Records
Mortgage History
| Date | Status | Borrower | Loan Amount |
|---|---|---|---|
| Open | Pothier Timothy A | $166,630 | |
| Closed | Pothier Timothy A | $111,050 |
Source: Public Records
Tax History
| Year | Tax Paid | Tax Assessment Tax Assessment Total Assessment is a certain percentage of the fair market value that is determined by local assessors to be the total taxable value of land and additions on the property. | Land | Improvement |
|---|---|---|---|---|
| 2025 | $38 | $317,800 | $145,000 | $172,800 |
| 2024 | $3,598 | $289,000 | $124,900 | $164,100 |
| 2023 | $3,588 | $271,400 | $124,900 | $146,500 |
| 2022 | $3,462 | $251,800 | $108,600 | $143,200 |
| 2021 | $3,383 | $236,900 | $103,400 | $133,500 |
| 2020 | $3,237 | $222,800 | $91,500 | $131,300 |
| 2019 | $2,875 | $217,000 | $91,500 | $125,500 |
| 2018 | $3,987 | $208,600 | $88,000 | $120,600 |
| 2017 | $3,781 | $206,700 | $98,600 | $108,100 |
| 2016 | $2,910 | $196,100 | $98,600 | $97,500 |
| 2015 | $2,668 | $191,800 | $98,600 | $93,200 |
| 2014 | $2,582 | $201,600 | $107,000 | $94,600 |
Source: Public Records
Map
Nearby Homes
Your Personal Tour Guide
Ask me questions while you tour the home.