57 Montvale St Roslindale, MA 02131
Roslindale NeighborhoodEstimated Value: $847,000 - $1,123,000
About This Home
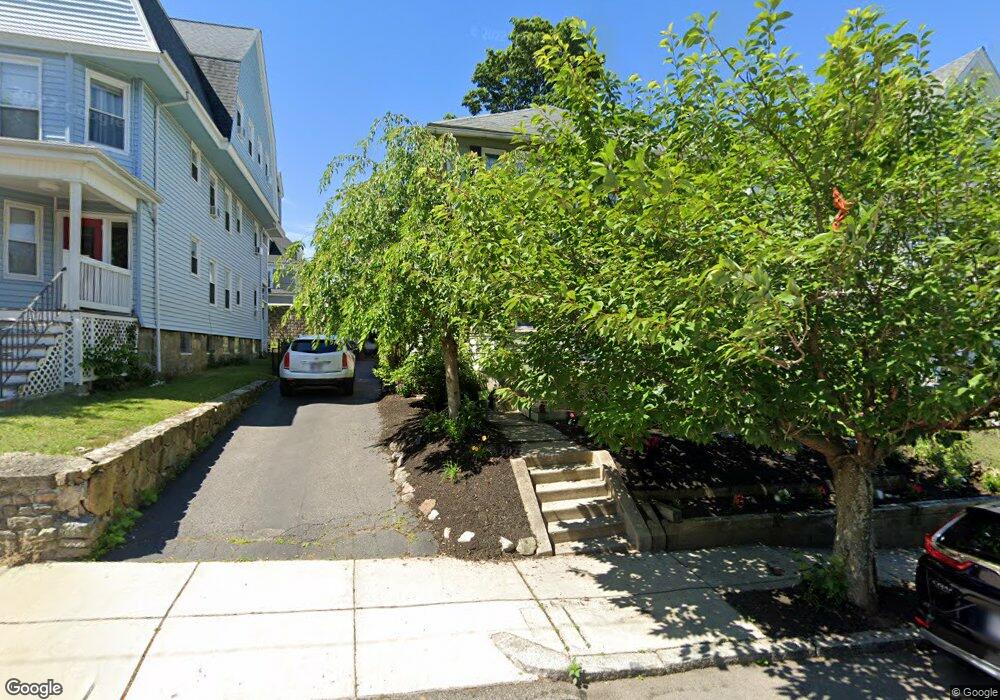
This home is located at 57 Montvale St, Roslindale, MA 02131 and is currently estimated at $1,014,427, approximately $473 per square foot. 57 Montvale St is a home located in Suffolk County with nearby schools including Holy Name Parish School and The Roxbury Latin School.
Ownership History
We collect this data history from publicly available records. To have your information removed, we recommend requesting removal directly through your county’s website.
Purchase Details
Home Financials for this Owner
Home Financials are based on the most recent Mortgage that was taken out on this home.Home Values in the Area
Average Home Value in this Area
Purchase History
We collect this data history from publicly available records. To have your information removed, we recommend requesting removal directly through your county’s website.
| Date | Buyer | Sale Price | Title Company |
|---|---|---|---|
| $350,000 | -- |
Mortgage History
We collect this data history from publicly available records. To have your information removed, we recommend requesting removal directly through your county’s website.
| Date | Status | Borrower | Loan Amount |
|---|---|---|---|
| Open | $314,650 |
Tax History
We collect this data history from publicly available records. To have your information removed, we recommend requesting removal directly through your county’s website.
| Year | Tax Paid | Tax Assessment Tax Assessment Total Assessment is a certain percentage of the fair market value that is determined by local assessors to be the total taxable value of land and additions on the property. | Land | Improvement |
|---|---|---|---|---|
| 2025 | $10,723 | $926,000 | $307,800 | $618,200 |
| 2024 | $9,584 | $879,300 | $282,500 | $596,800 |
| 2023 | $8,909 | $829,500 | $266,500 | $563,000 |
| 2022 | $8,276 | $760,700 | $244,400 | $516,300 |
| 2021 | $7,805 | $731,500 | $235,000 | $496,500 |
| 2020 | $6,925 | $655,800 | $217,900 | $437,900 |
| 2019 | $6,513 | $617,900 | $178,800 | $439,100 |
| 2018 | $5,888 | $561,800 | $178,800 | $383,000 |
| 2017 | $5,890 | $556,200 | $178,800 | $377,400 |
| 2016 | $5,612 | $510,200 | $178,800 | $331,400 |
| 2015 | $5,033 | $415,600 | $150,100 | $265,500 |
| 2014 | $5,075 | $403,400 | $150,100 | $253,300 |
Map
- 96 Beech St
- 209 Beech St
- 101 Tyndale St
- 419 Belgrade Ave Unit 2
- 110 Anawan Ave
- 167 Stratford St
- 15 Hillock St Unit 2
- 1721 Centre St Unit 402
- 1721 Centre St Unit 304
- 95 Orange St
- 6 Park Terrace
- 46 Woodard Rd
- 778 W Roxbury Pkwy
- 40 Woodard Rd
- 979 South St Unit 2
- 66 Wren St
- 66,66-R,70 Wren St
- 70 Wren St
- 41 Sunset Hill Rd
- 73 Bradfield Ave Unit 1
- 53 Montvale St Unit 3
- 53 Montvale St
- 53 Montvale St Unit 2
- 53 Montvale St Unit 1
- 57 Montvale St Unit 1
- 49 Montvale St Unit 1
- 49 Montvale St
- 49 Montvale St Unit 2
- 61 Montvale St
- 45 Montvale St
- 45 Montvale St Unit 1
- 45 Montvale St Unit 3
- 40 Lorraine St
- 36 Lorraine St
- 36 Lorraine St
- 36 Lorraine St Unit 2
- 36 Lorraine St Unit 1
- 32 Lorraine St
- 32 Lorraine St Unit 3
- 44 Lorraine St
Ask me questions while you tour the home.